gunisha
- 1
- 0
Hi!
I have a LC circuit in pspice schematics, i want to simulate graph: input voltage versus frequency,to see resonance voltage. To simulate at least something i must give power source (VAC) some value,so when i choose to trace voltage in power source at the graph, its the constant value at all frequencies. at the "setup analyisis" i choosed "AC sweep" and set start and end frequencies.
All i can get is inductor/conductor current versus frequency.
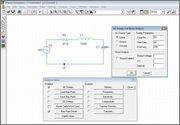
So is there any way to make a input voltage versus frequency graph?

I tried to use "parametric" in "setup analyisis" to set values to power source, but it didn helped.
I have a LC circuit in pspice schematics, i want to simulate graph: input voltage versus frequency,to see resonance voltage. To simulate at least something i must give power source (VAC) some value,so when i choose to trace voltage in power source at the graph, its the constant value at all frequencies. at the "setup analyisis" i choosed "AC sweep" and set start and end frequencies.
All i can get is inductor/conductor current versus frequency.
So is there any way to make a input voltage versus frequency graph?
I tried to use "parametric" in "setup analyisis" to set values to power source, but it didn helped.
Homework Statement
Homework Equations
The Attempt at a Solution
Last edited: