btb4198
- 570
- 10
- TL;DR
- Pulse Oximetry equations
I wrote a program that uses your computer camera to monitor your Pulse Oximetry and get your heart rate.
I got the program to work. I can see the heart beat in my graph.
Anyhow, I set my timer interval to 0.0226757 ms which is 44100 hz.
so I have a few questions,
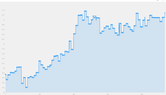
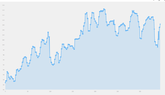
I was seeing a lot of noise at 1st, so I started taking the average of every five samples and plotting that.
Not filter:

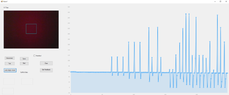
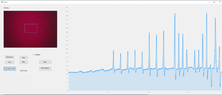
Filter graph:
 Now you can see the heart beat.
Why was there so much noise? Where is this noise even coming from ? Is there a better number for average measurement, I should be using ? if so How do I determine the best number for average measurement ?
What kind of filter is average number measurement? How does it work ?
From this graph how do you determine the heart rate?
I got the program to work. I can see the heart beat in my graph.
Anyhow, I set my timer interval to 0.0226757 ms which is 44100 hz.
so I have a few questions,
I was seeing a lot of noise at 1st, so I started taking the average of every five samples and plotting that.
Not filter:
Filter graph:
Why was there so much noise? Where is this noise even coming from ? Is there a better number for average measurement, I should be using ? if so How do I determine the best number for average measurement ?
What kind of filter is average number measurement? How does it work ?
From this graph how do you determine the heart rate?