Question about a measured spectra

  • A
  • Thread starter BillKet
  • Start date
  • Tags
    Spectra
In summary, The conversation discusses the measurement of spectra showing transitions from the ground state to an excited state with various molecular constants. The individual is trying to fit the measured spectra using a formula involving temperature, rotational constant, and vibrational levels. They are seeking advice on how to proceed with the fitting process and questioning the presence of multiple vibrational transitions in the spectra. The issue of rotational peaks and their effect on the spectra is also discussed.
  • #1
BillKet
312
29
Hello! I have the spectra below measured, which shows transitions from a ##^{2}\Sigma_+## electronic level (the ground state) to an excited ##\Omega=3/2## level (there are several other level around it, so I decided that using Hund case c would be better, than Hund case a, but in Hund case a this state would be mainly ##^{2}\Pi_{3/2}##). I know the molecular constants of the ##^{2}\Sigma_+## state and I would like to get some values for the excited state. The resolution is not great, so I don't expect really accurate values, but ideally I would like to fit something of the form: $$T_{3/2}+B_{3/2}J(J+1)+D_{3/2}[J(J+1)]^2$$
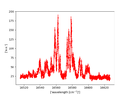
The molecules are quite hot, so we have several vibrational levels populated (at least the first 4-5 based on some preliminary experiments). However, I am not really able to bring the simulated spectra (I am using pgopher) close to this measured one, such that I can start the fit from a region close to the truth one. I can get a pair of left/right peaks (on the left and right of that central empty zone) for the right parameters for a given vibrational transition, but I get only 1 pair of peaks. However my spectra seems to have a lot of those (almost like the spectra is mirrored around that empty region) and adding more vibrational levels doesn't really help much. New vibrational levels are shifted to the left or to the right with respect to each other, but what I would need is something that stays at the center, in the empty region, but moves the left and right peaks further away from each other. I was not able to get this effect. Has anyone seen a spectra like this before? Can someone give me any advice on how to proceed? Thank you!
 

Attachments

  • plot_3_2.png
    plot_3_2.png
    10.2 KB · Views: 110
  • Like
Likes Twigg
Physics news on Phys.org
  • #2
How hot were the molecules? Temperature or Doppler linewidth is fine.

As you mentioned, adding more vibrational states doesn't add mirrored peaks like you see. Have you tried adding more rotational states to the initial distribution beyond the 4-5 you originally saw? That's what would make the most sense to me.

BillKet said:
However, I am not really able to bring the simulated spectra (I am using pgopher) close to this measured one, such that I can start the fit from a region close to the truth one. I can get a pair of left/right peaks (on the left and right of that central empty zone) for the right parameters for a given vibrational transition, but I get only 1 pair of peaks.
You did try sweeping the value of ##B_{3/2}##, right? And you still only see one peak? Even though you have 4-5 rotational levels populated initially? That doesn't make a whole lot of sense.
 
  • #3
Twigg said:
How hot were the molecules? Temperature or Doppler linewidth is fine.

As you mentioned, adding more vibrational states doesn't add mirrored peaks like you see. Have you tried adding more rotational states to the initial distribution beyond the 4-5 you originally saw? That's what would make the most sense to me.You did try sweeping the value of ##B_{3/2}##, right? And you still only see one peak? Even though you have 4-5 rotational levels populated initially? That doesn't make a whole lot of sense.
Thank you for your reply! By more rotational states, you mean rotational states that are populated in the ground state? Currently I didn't set a cut on that. The temperature in pgopher is set to 500K and I have all the J values between 0 and 100.

Do you mean that each of the peaks we see there is actually a rotational peak? This is what confuses me. The width of each peak is a few tens of GHz, so each peak in the plot has a few tens of rotational peaks under it. So I assumed that each pair of left-right peak is actually one vibrational transition (including all the transition from multiple rotational levels). But again, that accounts for only one pair of peaks. Changing the rotational constants makes one such pair change its shape a bit, but doesn't add new peaks.
 
  • #4
BillKet said:
This is what confuses me. The width of each peak is a few tens of GHz, so each peak in the plot has a few tens of rotational peaks under it.
Right, sorry, dumb oversight on my part. I think I just got confused because you presented a formula for rotational spectra as what you wanted to fit to.

Yeah ok I see what you mean now. Weirdly, your spectrum would make sense if you somehow magically had a Franck Condon factor of 0 for the ##\Delta \nu = 0## line, but that seems unlikely to me. I'm biased though because I've only ever worked on molecules with low vibrational branching ratios (i.e., molecules that lend themselves to quantum state control, and thus have highly diagonal FCFs).
 
  • #5
Twigg said:
Right, sorry, dumb oversight on my part. I think I just got confused because you presented a formula for rotational spectra as what you wanted to fit to.

Yeah ok I see what you mean now. Weirdly, your spectrum would make sense if you somehow magically had a Franck Condon factor of 0 for the ##\Delta \nu = 0## line, but that seems unlikely to me. I'm biased though because I've only ever worked on molecules with low vibrational branching ratios (i.e., molecules that lend themselves to quantum state control, and thus have highly diagonal FCFs).
I see what you mean. But from the theoretical predictions this should be highly diagonal. There will be some off-diagonal terms, but highly suppressed (not sure if we would see them at all).

Could it be that I need other terms in the Hamiltonian (although I don't they will be big enough to change anything)?
 
  • #6
What's your ground state vibrational constant (harmonic frequency)?
 
  • #7
Twigg said:
What's your ground state vibrational constant (harmonic frequency)?
It is about 400 cm##^{-1}##.
 
  • #8
Yep, sorry, I'm stumped. I can't see how your vibrational spectrum would look like that (no central peak for the diagonal lines) unless you had another quantum number involved (splitting into two peaks for the diagonal lines). I didn't think an omega doublet or lambda doublet could be as big as 10's of cm-1 though. I'm going to shut up until the real spectroscopy gurus get around to this. o:)
 

1. What is a measured spectra?

A measured spectra refers to the distribution of electromagnetic radiation (such as light or radio waves) over a range of wavelengths or frequencies. It is typically represented as a graph or chart, with the intensity of the radiation on the y-axis and the wavelength or frequency on the x-axis.

2. How is a measured spectra obtained?

A measured spectra is obtained by using a spectrometer or spectrophotometer to measure the intensity of electromagnetic radiation at different wavelengths or frequencies. The sample being measured is typically placed in the path of the radiation, and the spectrometer records the intensity of the radiation after it has passed through the sample.

3. What can a measured spectra tell us?

A measured spectra can provide information about the composition, structure, and properties of a sample. Different substances absorb and emit electromagnetic radiation at different wavelengths, so by analyzing the peaks and patterns in a measured spectra, scientists can identify the components of a sample and gain insight into its physical and chemical properties.

4. How is a measured spectra used in scientific research?

A measured spectra is used in a variety of scientific fields, including chemistry, physics, and astronomy. It can be used to identify unknown substances, study the behavior of molecules and atoms, and analyze the composition of distant objects in space. In addition, changes in a measured spectra over time can provide valuable information about chemical reactions and physical processes.

5. What factors can affect a measured spectra?

Several factors can affect a measured spectra, including the type of radiation being used, the properties of the sample being measured, and the instrument used to record the spectra. Other factors, such as temperature, pressure, and the presence of impurities, can also influence the shape and intensity of peaks in a measured spectra.

Similar threads

  • Atomic and Condensed Matter
Replies
0
Views
370
  • Atomic and Condensed Matter
Replies
1
Views
1K
  • Atomic and Condensed Matter
Replies
1
Views
1K
  • Atomic and Condensed Matter
5
Replies
156
Views
7K
  • Atomic and Condensed Matter
Replies
1
Views
697
  • Atomic and Condensed Matter
Replies
9
Views
6K
  • Atomic and Condensed Matter
Replies
8
Views
1K
  • Atomic and Condensed Matter
Replies
1
Views
2K
Replies
8
Views
2K
  • Atomic and Condensed Matter
Replies
0
Views
1K
Back
Top