Real Experiment-MCBEND Simulation

Join the discussion
Ask a follow-up here, or get your own question answered by working scientists, mathematicians and engineers — people, not an autocomplete.
Real named experts · corrections over time · the nuance an AI answer skips
6 replies · 3K views
gxa
Messages
24
Reaction score
3
TL;DR
Normalization for simulation results
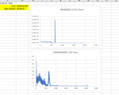
Do I need to apply normalization these two graphs to make them similar to each other and if so, how can I do this? I would be very grateful if you can help me if these results are consistent. I compared the results of the experiment and the results of the mcbend simulation.
 

Attachments
Physics news on Phys.org
gxa said:
TL;DR Summary: Normalization for simulation results

Do I need to apply normalization these two graphs to make them similar to each other and if so, how can I do this? I would be very grateful if you can help me if these results are consistent. I compared the results of the experiment and the results of the mcbend simulation.
It's best not to post documents that can contain macros, like Word or Excel documents. It's better to upload a PDF or JPEG image of your work to help folks understand your question.

Is this for MCNP work? If so, I can move the thread to the Nuclear Engineering forum, where such questions usually go. Finally, is this for schoolwork? What is the context of the question? Thanks.
 
Got it, thanks. Can you move my question to nuclear engineering section and this is not a homework. Also, I added the necessary graphics for my question as a picture again.
 

Attachments

  • graph.PNG
    graph.PNG
    6.6 KB · Views: 160
Reply
  • Like
Likes   Reactions: berkeman
What do you want to learn from your data? Where does it come from?

It's possible the simulation hasn't been scaled to match the expected experimental result. In that case a normalization is useful. If you want to normalize to the same integral, or same integral of a peak, or something else, will depend on your experiment and your data analysis goal.
 
yes, I did not scale the data. what I want to do is to make the graphs similar. But I don't know exactly how to make normalization
 
gxa said:
what I want to do is to make the graphs similar.
Similar in what way, for what purpose?

Your experimental graph doesn't have the same shape as the theoretical one so they won't match up nicely no matter what you do.
 
I think my code is the same as the environment I have set up. I am investigating the accuracy of the simulation. These are the measurements of my detector and I added my code
1692791605783.png
 

Attachments