MHB Recommend books for dynamical systems?

nacho-man
Messages
166
Reaction score
0
I am finding some topics a bit obscurely explained.
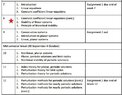
I have attached the curriculum/study guide we are using, and was hoping someone could suggest books which cover these bases.

Particularly finding week 8 a bit difficult at the moment, especially stability (surely just more robust revision and studying is required) but i haven't been successful in finding similar topics covered in textbooks.

I am using Kreyzig advanced engineering mathematics and also PV Oneil's advanced eng mathematics.

Any help is appreciated!
 

Attachments

  • topics.jpg
    topics.jpg
    29.4 KB · Views: 102
Physics news on Phys.org
thanks, I had a look at your notes prior as well.

Is there any way to download them?
 
nacho said:
thanks, I had a look at your notes prior as well.

Is there any way to download them?

No, it is setup so you can't.
 
There is the following linear Volterra equation of the second kind $$ y(x)+\int_{0}^{x} K(x-s) y(s)\,{\rm d}s = 1 $$ with kernel $$ K(x-s) = 1 - 4 \sum_{n=1}^{\infty} \dfrac{1}{\lambda_n^2} e^{-\beta \lambda_n^2 (x-s)} $$ where $y(0)=1$, $\beta>0$ and $\lambda_n$ is the $n$-th positive root of the equation $J_0(x)=0$ (here $n$ is a natural number that numbers these positive roots in the order of increasing their values), $J_0(x)$ is the Bessel function of the first kind of zero order. I...
Are there any good visualization tutorials, written or video, that show graphically how separation of variables works? I particularly have the time-independent Schrodinger Equation in mind. There are hundreds of demonstrations out there which essentially distill to copies of one another. However I am trying to visualize in my mind how this process looks graphically - for example plotting t on one axis and x on the other for f(x,t). I have seen other good visual representations of...

Similar threads

Replies
4
Views
2K
Replies
8
Views
208
Replies
4
Views
3K
Replies
5
Views
2K
Replies
0
Views
927
Back
Top