Science Teacher Seeks Help Explaining Work-Kinetic Energy Lab Data

Join the discussion
Ask a follow-up here, or get your own question answered by working scientists, mathematicians and engineers — people, not an autocomplete.
Real named experts · corrections over time · the nuance an AI answer skips
10 replies · 4K views
tzonehunter
Messages
24
Reaction score
2
Hello everyone,

I teach Physics at a local high school. I designed a simple lab to determine the relationship between net work and kinetic energy. The diagram is shown below:
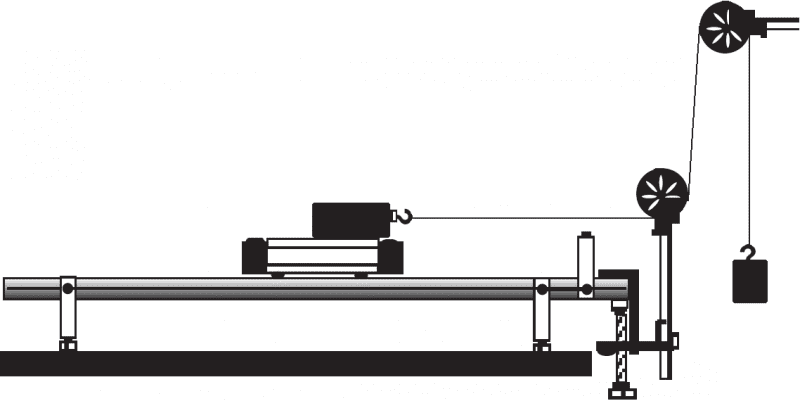
WorkIntroLabDiagram_zpsa4fa618e.png


In this experiment, students release the cart from rest, while keeping displacement constant. A Vernier motion detector measures the velocity of the cart as it rolls. Students change the mass of the metal weight and repeat (50 g, 100 g, 150 g, 200 g). They then keep the mass of the metal weight constant and change the displacement. Finally, they plot FΔx vs. vf.

The plot of FΔx vs. vf^2 is linear. The slope should be 1/2m. The mass of the cart/force sensor apparatus is 645 g, so we would expect the slope of the FΔx vs. vf^2 plot to be approximately 0.32. We're seeing slopes of 0.43 - 0.47 (skewed towards the high side).

The cart and pulleys are both very low friction. The pulleys have a very low mass (they're a light weight plastic). Can anyone help explain this discrepancy?
 
Physics news on Phys.org
I wonder, do you have to include the mass of the metal weight? The force of gravity is pulling on both it and the cart/weight system. This would drive up your slope.
 
The force sensor is attached to the cart and records the force exerted on the cart (the tension) as the cart is rolling. We have software and digital interfaces that read force and position data in real time (Vernier Lab Pro / Logger Pro).

In terms of the tension force, in the absence of friction, it's the net force exerted on the cart. Since we're measuring the final velocity of the cart (starting from rest), Wnet (FnetΔx) should equal 1/2mvf^2.
 
tzonehunter said:
The force sensor is attached to the cart and records the force exerted on the cart (the tension) as the cart is rolling. We have software and digital interfaces that read force and position data in real time (Vernier Lab Pro / Logger Pro).

In terms of the tension force, in the absence of friction, it's the net force exerted on the cart. Since we're measuring the final velocity of the cart (starting from rest), Wnet (FnetΔx) should equal 1/2mvf^2.
So, do you get a whole slew of triples of values: force, position, timestamp? If not, how does the logger determine when to take samples?
 
The tension prior to releasing the cart the tension is ##mg##, where ##m## is the mass of the hanging metal weight. Once the cart is released, the tension drops to ##\frac M{M+m} mg##, where ##M## is the mass of the cart assembly. This decrease will be greatest with the 200 gram weight, and from the description it appears this is the weight used when the students vary ##\Delta x##. If the students use that higher pre-release tension value as opposed to the while-rolling tension value they will see a curve that is only slightly non-linear but can be markedly sloped compared to the expected slope of 0.32 kg, particularly if the varying ##\Delta x## part of the experiment is done with the 200 gram weight.
 
D H said:
The tension prior to releasing the cart the tension is ##mg##, where ##m## is the mass of the hanging metal weight. Once the cart is released, the tension drops to ##\frac M{M+m} mg##, where ##M## is the mass of the cart assembly. This decrease will be greatest with the 200 gram weight, and from the description it appears this is the weight used when the students vary ##\Delta x##. If the students use that higher pre-release tension value as opposed to the while-rolling tension value they will see a curve that is only slightly non-linear but can be markedly sloped compared to the expected slope of 0.32 kg, particularly if the varying ##\Delta x## part of the experiment is done with the 200 gram weight.
That was the point of my question in post #3, but tzonehunter indicates the tension is measured while the cart is in motion.
 
I understand that, haruspex. Here's one explanation: The students saw what was to them a confusing time series, with tension high and steady at the start, then a bunch of transients (explain that to high school students!), and finally a signal that somewhat stabilizes to a significantly noisier signal than that nice steady signal. That steady, pre-release signal is exactly what they should be rejecting, but it may well be exactly what they are using.
 
Hi Everyone,

Unfortnately, this was not student error (although that explanation is plausible). It turns out that the force sensors have issues when they are accelerated. I discovered this when I was working on a lab to determine the affect of friction as a wood block & force sensor is accelerated using the same apparatus. This was an unexpected result... The force readings are all higher than they should be. The wood block and force sensor had a total mass of about 640 g. The mass hanging from the pulley was 0.200 kg. I was getting tension readings of 2.4 N as the wood block was accelerating. In a frictionless scenario, this is much higher than the expected 1.76 N.
 
Hi George,

Yes, I was careful when calibrating force sensors. I actually calibrate them with the wood block/cart & force sensor apparatus connected and static. This way the mass of the metal hanger doesn't influence the calibration.