Test of hypothesis for independent samples

  • Thread starter Thread starter chwala
  • Start date Start date
  • Tags Tags
    Independent Test
Click For Summary

Homework Help Overview

The discussion revolves around hypothesis testing for independent samples, specifically focusing on t-tests. Participants explore the differences between independent and paired sample tests, the significance levels used in hypothesis testing, and the implications of these choices on research findings.

Discussion Character

  • Exploratory, Conceptual clarification, Assumption checking

Approaches and Questions Raised

  • Participants discuss the appropriateness of subtracting scores in t-tests and question the rationale behind using a 5% alpha level as a standard. There is also exploration of the implications of focusing on significance versus effect size in research.

Discussion Status

The conversation is ongoing, with various perspectives on the conventions of hypothesis testing being shared. Some participants have offered insights into the criticisms of the alpha level convention and the importance of effect sizes, indicating a productive exploration of the topic.

Contextual Notes

Participants note the common conventions in hypothesis testing and the challenges related to reproducibility in scientific research, particularly in social sciences. There is an acknowledgment of the limitations of binary significance classifications.

chwala
Gold Member
Messages
2,828
Reaction score
425
Homework Statement
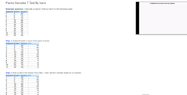
Kindly look at the link below ( the steps are pretty clear to me) i need some clarification though.
Relevant Equations
Stats
Reference;

https://www.statisticshowto.com/probability-and-statistics/t-test/

My question is, can we as well have 'subtract each ##x## score from each ##y## score?' thanks.
...t-tests after all are easy to comprehend; as long as one knows the types;
i.e
1. indepedent sample tests (compares means btwn groups)
2. Paired sample(mean from same group comaprison) &
3. One sample

then you good to go... then a matter of understanding Dof and alpha level as compared to calculated value to ascertain any of the given hypothesis questions.
 

Attachments

  • stats1.png
    stats1.png
    16.2 KB · Views: 164
Last edited:
Physics news on Phys.org
Yes, you can. See the note under step 8.
 
  • Like
Likes   Reactions: chwala
Why does the author indicate that if you do not have a specified alpha value then use ##5\%##, any specific/particular reason? Why not ##2\%## or ##10\%## in that matter i.e reference step##7##.
 
For the paired t-test, from:
https://www.statisticshowto.com/probability-and-statistics/t-test/ ( My bold)

"When to Choose a Paired T Test / Paired Samples T Test / Dependent Samples T Test​


Choose the paired t-test if you have two measurements on the same item, person or thing. But you should also choose this test if you have two items that are being measured with a unique condition. For example, you might be measuring car safety performance in vehicle research and testing and subject the cars to a series of crash tests. Although the manufacturers are different, you might be subjecting them to the same conditions.

With a “regular” two sample t test, you’re comparing the means for two different samples. For example, you might test two different groups of customer service associates on a business-related test or testing students from two universities on their English skills. But if you take a random sample each group separately and they have different conditions, your samples are independent and you should run an independent samples t test (also called between-samples and unpaired-samples).The null hypothesis for the independent samples t-test is μ1 = μ2. So it assumes the means are equal. With the paired t test, the null hypothesis is that the pairwise difference between the two tests is equal (H0: µd = 0). "

An issue, point I think is interesting here is that this technique is used in classification schemes. Tw o objects are in the same class if the variability between them is within a limited range, and in different classes otherwise. As in: How/When do we declare two dogs are of the same breed?
 
  • Like
Likes   Reactions: chwala
chwala said:
Why does the author indicate that if you do not have a specified alpha value then use ##5\%##, any specific/particular reason? Why not ##2\%## or ##10\%## in that matter i.e reference step##7##.
It's become something of a standard, through no specific reason I'm aware of. This has given rise to criticism on the basis of the choice/number being arbitrary. There's been some discusion to include effect size in such tests in part for this reason: If, say, the difference in outcome of two medicines is significant at some level, but the effect size is of minor, then you might not care as much. Meaning that one medicine will reduce duration of a cold by 3 days ( if untreated), while the other one will reduce duration by 4 days, then significance itself , is not of much value.
 
Last edited:
  • Informative
Likes   Reactions: chwala
chwala said:
Why does the author indicate that if you do not have a specified alpha value then use ##5\%##, any specific/particular reason? Why not ##2\%## or ##10\%## in that matter i.e reference step##7##.
It is a common convention in many fields. It's bad. The original idea sounds good: If you test one hypothesis in your study, then on average only 1 in 20 studies with no effect will falsely call something significant. In practice people rarely have just a single precisely defined hypothesis and don't correct their analyses properly for that. To make things worse many journals don't want to publish null results, giving scientists an even larger incentive to dig up something they can call significant, and also making it impossible to see how many studies are done in total. As a result, we get tons of "significant" results that are just random fluctuations. You can see it in distributions of p-values. The range *just* below 0.05 is more common than we should expect, nicely shown in this plot (z-values, so p=0.05 corresponds to z=1.96)

Significance isn't the interesting property anyway. If your sample size is large enough you'll always find a significant effect for essentially everything - that doesn't mean it's relevant. If option 1 reduces some risk by 2% +-0.5% (p<0.001 for having an effect) and option 2 reduces the risk by 40% +- 21% (p>0.05), which option do you prefer? The second one, of course - despite the smaller significance it's far more likely to help a lot, while the first option is a certain but minimal reduction.
More studies should report effect sizes instead of focusing on arbitrary "significance" points.
 
  • Like
Likes   Reactions: WWGD
mfb said:
It is a common convention in many fields. It's bad. The original idea sounds good: If you test one hypothesis in your study, then on average only 1 in 20 studies with no effect will falsely call something significant. In practice people rarely have just a single precisely defined hypothesis and don't correct their analyses properly for that. To make things worse many journals don't want to publish null results, giving scientists an even larger incentive to dig up something they can call significant, and also making it impossible to see how many studies are done in total. As a result, we get tons of "significant" results that are just random fluctuations. You can see it in distributions of p-values. The range *just* below 0.05 is more common than we should expect, nicely shown in this plot (z-values, so p=0.05 corresponds to z=1.96)

Significance isn't the interesting property anyway. If your sample size is large enough you'll always find a significant effect for essentially everything - that doesn't mean it's relevant. If option 1 reduces some risk by 2% +-0.5% (p<0.001 for having an effect) and option 2 reduces the risk by 40% +- 21% (p>0.05), which option do you prefer? The second one, of course - despite the smaller significance it's far more likely to help a lot, while the first option is a certain but minimal reduction.
More studies should report effect sizes instead of focusing on arbitrary "significance" points.
mfb,is this the main issue in terms of the problem of replicability/reproducibility of results in the social sciences? Is it a problem throughout all sciences, rather than just social sciences?
 
I think if people would focus more on effect sizes and confidence intervals and be fine with publishing null results we would reduce the problem and increase reproducibility a lot. Reproduction would be results consistent within the uncertainties.

That's another issue of a binary "significant"/"not significant" classification. If one study claims it's significant (odds ratio 1.35, p=0.02, 95% CI from 1.05 to 1.65)) and a similar study says it's not (odds ratio 1.25, p=0.10, 95% CI from 0.95 to 1.55), do they disagree? Of course not - they are within one standard deviation of each other. But they seem to say very different things.

There are fields that do it much better and particle physics is among them. Most studies are repetitions (typically but not always with better precision), most results of searches are null results (which do get published without issue), failing to reproduce previous measurements is very rare even for the measurements which measure a non-zero value.
 
  • Like
Likes   Reactions: chwala and WWGD

Similar threads

  • · Replies 10 ·
Replies
10
Views
2K
  • · Replies 1 ·
Replies
1
Views
3K
Replies
13
Views
3K
  • · Replies 1 ·
Replies
1
Views
1K
  • · Replies 11 ·
Replies
11
Views
3K
Replies
6
Views
4K
  • · Replies 8 ·
Replies
8
Views
2K
  • · Replies 5 ·
Replies
5
Views
3K
Replies
4
Views
3K
Replies
20
Views
2K