Time Dilation & Length Contraction: Graphically Explained

In summary, the thread "twin paradox without math" inspired me try to find fully graphical solution of length contraction.I created three-dimensional spacetime diagrams of the twin paradox, the Michelson-Morley experiment, and the clock effect, and found that length contraction is necessary for both the twin paradox and the Michelson-Morley experiment. These diagrams are helpful for understanding the twin paradox and the Michelson-Morley experiment, as well as the clock effect, without needing to understand math. However, I think two-dimensional visualizations are more useful for understanding these phenomena.
  • #1
Tomas Vencl
57
13
TL;DR Summary
Time dilation and length contraction graphically
The thread "twin paradox without math" inspired me try to find fully graphical solution of length contraction.
Here is the result:
?hash=200f568d21abc19ba86a024e0d14aef9.jpg

Graph is 3D as I think that is ilustrative to make all in one graph, but I am sure that it is possible to do it in 2 or 3 2D slices.
X and Y are spatial axes, T is time (static observer), light cone is 45 degree, so this is Minkowski spacetime.
There are 3 sets of light clocks at the picture.
The green one is standard static (in front plane) light clock (one tick) and defines scales of the axes (for example, if mirors are 1light second distant, the tick last 2 seconds).
The orange light beam is 2 second tick of moving (along Y axe, in plane 1) clock. The orange beam is intersection of plane 1 and lightcone surface.
The blue light beam is 2 second tick of clock moving along X axe. Because all clocks shoud show the same time independently on their orientation (at given speed), the 2 second tick of blue clocks should have the same duration as orange clocks. From this condition you can derive length contaction. Simply draw 45 degree blue lines from origin and final position of first mirror of blue clocks and their intersection defines necessary event of reflecting beam at second mirror of blue light clocks. This also define length contaction of blue light clocks.
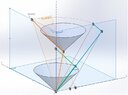
 

Attachments

  • Snímek obrazovky 2022-11-21 130935.jpg
    Snímek obrazovky 2022-11-21 130935.jpg
    38.9 KB · Views: 85
  • Like
Likes robphy
Physics news on Phys.org
  • #2
Sorry to say, but I don’t think this diagram is clear at all. Particularly as you can easily make the graphical argument with two clocks only while only including a single spatial direction (the direction of motion).
 
  • #3
Also one must note that you cannot interpret lengths in a Minkowski diagram in the Euclidean way, i.e., the unit marks on the axes of different inertial frames have not the same Eucldean but the same Minkowskian "length", i.e., they have to be constructed by the space- and time-like unit hyperbolae. I also think Minkowski diagrams are only helpful when discussing one-dimensional motions, i.e., when you have a time-space plane. Then the unit hyperbolae are given (for pseudo-Euclidean, i.e., Lorentzian coordinates)
$$(c t)^2-x^2=\pm 1.$$
 
  • #4
vanhees71 said:
Also one must note that you cannot interpret lengths in a Minkowski diagram in the Euclidean way, i.e., the unit marks on the axes of different inertial frames have not the same Eucldean but the same Minkowskian "length", i.e., they have to be constructed by the space- and time-like unit hyperbolae. I also think Minkowski diagrams are only helpful when discussing one-dimensional motions, i.e., when you have a time-space plane. Then the unit hyperbolae are given (for pseudo-Euclidean, i.e., Lorentzian coordinates)
$$(c t)^2-x^2=\pm 1.$$
Yes, when you construct the "orange clocks tick" for different motions of orange clocks (different angle of plane 1), you receive this hyperbola (yellow, second positions of first orange miror for different orange clocks movements along Y axe).
Hyperbola is at Y-T plane, the other yellow line is only asymptote at 45 degree for easier orientation in graph.

Snímek obrazovky 2022-11-22 113540.jpg
 
  • Like
Likes robphy and vanhees71
  • #5
Maybe I should add some remarks. This is Minkowski spacetime, and axis X,Y,T are valid only for static observer.
The motion of orange clocks is one-dinesional, along Y axe, The motion of blue clocks i also one dimensional, along X axe.
 
  • #6
I encourage you to continue making (2+1)-dimensional spacetime visualizations!
Sometimes they give insights that are not so easy to see in the (1+1)-case.

I think 3D-visualizations are more useful when a viewer can see multiple viewpoints
(possibly interactively, using say geogebra.org - see below)
as opposed to a static image... unless there are enough labels, formulae, or visual cues.

Your diagrams are nice.
Some suggestions:
  • It might be good to draw the full "1 tick to the future" hyperboloid (asymptotic to the light cone of the origin event) on which the reception events lie.
  • It also might be good to draw the past light cones of those reception events,
    and their intersections with the future light cone of the origin event.
    The intersections locate the hyperplanes of simultaneity of those clocks.
    You may also find that (2+1)-dimensional volumes enclosed by those cones are equal in magnitude (i.e. is a Lorentz variant quantity).
  • If you also draw the transverse light clock moving along the forward X-axis,
    you would have drawn the spacetime diagram of the Michelson-Morley experiment (with Length Contraction).
  • Possibly useful:
    Tevian Dray's "Using Three-dimensional Spacetime Diagrams in Special Relativity"
    https://ir.library.oregonstate.edu/downloads/5d86p0819
    American Journal of Physics 81, 593 (2013); https://doi.org/10.1119/1.4812591
Spoilers: here is my spacetime visualization of the Michelson Morley experiment.
https://www.geogebra.org/m/XFXzXGTq
which requires a (2+1)-dimensional spacetime diagram

Spolier: my visualization of a circular light clock (with references)
https://www.geogebra.org/m/pr63mk3j

In each, one can see time dilation and length contraction.

Spoilers: my (2+1)-dimensional spacetime visualizations (made with VPython)
my visualization suggesting the necessity of length contraction
VisualizingProperTime - Length Contraction
and
my visualization of the clock effect displaying the mechanism of a ticking light clock.
VisualizingProperTime - the Clock Effect / Twin Paradox with Circular Light Clocks (with audio)

(My comments from the other thread: https://www.physicsforums.com/threads/understanding-twin-paradox-without-math.1047245/post-6822789 )
 
Last edited:
  • #7
robphy said:
...
Thank you for your inspiring reply.
 

1. What is time dilation and length contraction?

Time dilation and length contraction are two concepts in Einstein's theory of relativity that describe how time and space are affected by the speed of an object. Time dilation refers to the slowing down of time for an object in motion, while length contraction refers to the shortening of an object's length in the direction of motion.

2. How are time dilation and length contraction related?

Time dilation and length contraction are related because they both occur due to the same underlying principle of relativity. As an object moves faster, time slows down and its length contracts, both of which can be observed and measured.

3. How can time dilation and length contraction be graphically explained?

Time dilation and length contraction can be graphically explained using the Lorentz transformation equations, which describe how time and space are affected by an object's velocity. These equations can be plotted on a graph to show the relationship between time, length, and velocity.

4. What is the significance of time dilation and length contraction?

The significance of time dilation and length contraction is that they challenge our traditional understanding of time and space. They also have practical applications, such as in GPS technology, where time dilation must be taken into account for accurate measurements.

5. Can time dilation and length contraction be observed in everyday life?

Yes, time dilation and length contraction can be observed in everyday life, although the effects are very small at everyday speeds. For example, astronauts on the International Space Station experience time dilation, and particles in accelerators also exhibit length contraction. However, these effects are only noticeable at extremely high speeds close to the speed of light.

Similar threads

  • Special and General Relativity
2
Replies
45
Views
2K
  • Special and General Relativity
Replies
10
Views
524
  • Special and General Relativity
Replies
16
Views
659
  • Special and General Relativity
Replies
2
Views
1K
  • Special and General Relativity
Replies
11
Views
991
  • Special and General Relativity
Replies
34
Views
3K
Replies
63
Views
3K
  • Special and General Relativity
Replies
7
Views
989
  • Special and General Relativity
2
Replies
36
Views
2K
  • Special and General Relativity
Replies
13
Views
1K
Back
Top