Use Graph To Investigate Limit

I'll worry about calculus 3 when I get there.In summary, based on the graph and the given information, it can be concluded that for both questions 24 and 26, the limit of the function f(x) as x approaches c does not exist. This is because the function values approach different heights from the left and right sides, and the presence of a hole in the graph does not affect the limit. Further investigation may be needed to determine the exact values of the limits.
  • #1
nycmathguy
Homework Statement
Graphs and Limits
Relevant Equations
Piecewise Functions
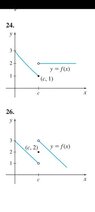
For questions 24 and 26, Use the graph to investigate limit of f(x) as x→c. If the limit does not exist, explain why.

Question 24

For (a), the limit is 1.

For (b), the limit is cannot be determined due to the hole at (c, 2).

For (c), LHL does not = RHL.

I conclude the limit does not exist.

You say?

Question 26

For (a), the limit is 2.

For (b), the limit cannot be determined due to the hole at (c, 3).

For (c), LHL does not = RHL.

I conclude the limit does not exist.

You say?
 

Attachments

  • Screenshot_20210613-144516_Drive.jpg
    Screenshot_20210613-144516_Drive.jpg
    8.5 KB · Views: 82
Last edited by a moderator:
Physics news on Phys.org
  • #2
nycmathguy said:
You say?
Did you forget to post the graph for these questions?
Also, just because there is a hole in the graph doesn't mean that a limit doesn't exist.
 
  • #3
Mark44 said:
Did you forget to post the graph for these questions?
Also, just because there is a hole in the graph doesn't mean that a limit doesn't exist.

Picture has been added.
 
  • #4
Ques. 24
nycmathguy said:
For (b), the limit is cannot be determined due to the hole at (c, 2).
No, this is incorrect. The presence or absence of a hole doesn't affect the limit.
As x approaches c from the right, what are the function values doing?

nycmathguy said:
I conclude the limit does not exist.
This is the correct conclusion, but you've based it on faulty reasoning.

Ques. 26
nycmathguy said:
For (a), the limit is 2.

For (b), the limit cannot be determined due to the hole at (c, 3).
No to both. As x approaches c from the left, what value are the function values approaching? The fact that the point (c, 2) is on the graph has nothing to do with what the limit might be.
As x approaches c from the right, what are the function values doing, again ignoring the point at (c, 2)?

nycmathguy said:
I conclude the limit does not exist.
Correct conclusion but based on faulty reasoning.
 
  • Like
Likes nycmathguy
  • #5
Mark44 said:
Ques. 24No, this is incorrect. The presence or absence of a hole doesn't affect the limit.
As x approaches c from the right, what are the function values doing?

This is the correct conclusion, but you've based it on faulty reasoning.

Ques. 26No to both. As x approaches c from the left, what value are the function values approaching? The fact that the point (c, 2) is on the graph has nothing to do with what the limit might be.
As x approaches c from the right, what are the function values doing, again ignoring the point at (c, 2)?

Correct conclusion but based on faulty reasoning.

Let me reply to yours one at a time from top to bottom.

1. As x tends to c from the right, f(x) goes to a height of 2.

2. Let me try 26 again.

As x tends to c from the left, f(x) goes to a height of 1.

As x tends to c from the right, f(x) goes to a height of 3.

Since the LHL does = THE RHL, the limit for f(x) does not exist.

You now say?
 
  • #7
Mark44 said:
They're all fine now.

This makes me feel better. I am slowly getting this limits stuff. I also know that limits is calculus 3 is very different. I am ok so far in the textbook.
 

1. What is a limit in a graph?

A limit in a graph refers to the value that a function approaches as the input approaches a specific value. It is represented by a horizontal line on the graph and can be used to determine the behavior of a function near a certain point.

2. How do you use a graph to investigate limits?

To investigate limits using a graph, you can plot the function and observe the behavior of the graph as the input approaches a specific value. You can also use the concept of a limit to find the value of a function at a point where it is not defined, by looking at the behavior of the graph near that point.

3. What is the importance of investigating limits using a graph?

Investigating limits using a graph can help us understand the behavior of a function and make predictions about its values at certain points. It also allows us to visualize and analyze the behavior of a function, which can be useful in many areas of mathematics and science.

4. What are the different types of limits that can be investigated using a graph?

The two main types of limits that can be investigated using a graph are one-sided limits and two-sided limits. One-sided limits involve approaching a value from either the left or right side of the graph, while two-sided limits involve approaching a value from both sides of the graph.

5. How can a graph help us understand the concept of continuity?

A graph can help us understand continuity by showing us the behavior of a function at a specific point. If the graph is continuous at a point, it means that the function is defined at that point and there are no gaps or breaks in the graph. If the graph is not continuous, it means that the function is not defined at that point or there is a discontinuity present.

Similar threads

  • Calculus and Beyond Homework Help
Replies
11
Views
737
  • Calculus and Beyond Homework Help
Replies
6
Views
885
  • Calculus and Beyond Homework Help
Replies
7
Views
830
  • Calculus and Beyond Homework Help
Replies
2
Views
750
  • Calculus and Beyond Homework Help
Replies
15
Views
1K
  • Calculus and Beyond Homework Help
Replies
2
Views
692
  • Calculus and Beyond Homework Help
Replies
10
Views
667
  • Calculus and Beyond Homework Help
Replies
3
Views
728
  • Calculus and Beyond Homework Help
Replies
10
Views
825
  • Calculus and Beyond Homework Help
Replies
2
Views
690
Back
Top