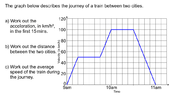
For (b) and (c) that integral is the "area under the curve". For b, I would think of this as:
1) a triangle with base "1/4 hour" and height "50 km/hr". The area of that triangle is (1/2)(1/4)(50)= 6.25 km.
2) a rectangle with base "1/2 hour" and height "50 km/hr". The area of that rectangle is (1/2)(50)= 25 km.
3) a trapezoid with bases "50 km/hr" and "100 km/hr" and height "1/4 hour" (yes, I've swapped "height" and "base" to better fit the trapezoid). The area is (1/2)(50+ 100)(1/4)= 18.75 km.
4) a rectangle with base "1/2 hr" and height "100 km/hr". The area is (1/2)(100)= 50 km.
5) a triangle with base "1/2 hr" and height "100 km". The area is (1/2)(1/2)(100)= 25 km.