Will The Cars Stop In Time? - Check My Work Please :)

  • Thread starter Thread starter valleyldp
  • Start date Start date
  • Tags Tags
    Cars Time
Click For Summary
SUMMARY

The discussion centers on the stopping distances of two drivers, Sarah and Andrew, based on their initial velocities and accelerations. Sarah's stopping time is calculated at 3.2 seconds with a stopping distance of 46 meters, while Andrew's stopping time is 5.1 seconds with a stopping distance of 120 meters. Both drivers will not reach their destinations safely, as their required stopping distances exceed the distances calculated. Key issues identified include the need for proper labeling on graphs and clarification of initial velocities and accelerations.

PREREQUISITES
  • Understanding of kinematic equations, specifically Δx = v_iΔt + ½a(Δt)^2
  • Familiarity with graphing velocity-time relationships
  • Knowledge of acceleration concepts, including positive and negative values
  • Experience with tools like Desmos for graphing
NEXT STEPS
  • Learn how to accurately label graphs in Desmos for clarity
  • Study the implications of positive and negative acceleration in motion analysis
  • Explore the kinematic equation 2ax = v_f^2 - v_0^2 for stopping distance calculations
  • Investigate the effects of initial velocity direction on graph interpretation
USEFUL FOR

Physics students, educators, and anyone involved in vehicle dynamics or accident analysis will benefit from this discussion.

valleyldp
Messages
7
Reaction score
4
Homework Statement
STORY PROBLEM:
Sarah is speeding down the highway westward at 65 mph. She notices ahead that an accident has resulted in a pile-up in the middle of the road. She slams on her brakes 35 meters from the accident, causing her car to slow at a rate of 9.1 m/s^2. Andrew is traveling the other way on the same highway at 45 m/s eastward. He also notices the accident and begins to brake 20 meters from the accident. His car decelerates at 8.8 m/s^2. Assuming a damaged car will keep them home from work, which of the two people will be able to make it to work the next day?

STEPS TO SOLVE:
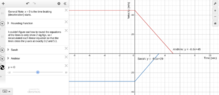
1. Draw a diagram to model the situation with relevant items labeled. Make sure you indicate which direction is east or west, and which of those you chose to be positive.

2. What are the signs for the following information as defined by your model? (Correct or not).

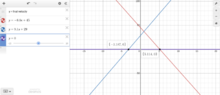
3. Construct a velocity versus time graph of both Sarah's and Andrew's motion in the same reference frame.

4. Write out the stopping time needed for each person indicated by the graph. (Correct sig figs and units required)

5. Use a kinematic equation to determine the distance needed for each person to stop. (Correct sig figs and units required)

6. Which personal will make it to work the next day?
Relevant Equations
Δx=v_iΔt+½a(Δt)^2
  1. Model attached below.
    1. Changed Sarah's 65 mph to m/s and got 29 m/s.
  2. Sarah's initial position is positive. Her initial velocity is negative. Her acceleration is positive; Andrew's initial position is negative. His initial velocity is positive. His acceleration is negative.
  3. Graph is attached below.
  4. Graph indicates a stopping time of 3.2 seconds for Sarah and 5.1 seconds for Andrew. (Two sig figs because measurements in initial problem were two sig figs.)
  5. Worked Out Equations (Δx=v_iΔt+½a(Δt)^2)
    1. Sarah
      1. Δx = unknown
      2. a = -9.1 m/s^2
      3. Initial Velocity = 29 m/s
      4. Δt = 3.2 seconds
      5. Answer: 46 meters
    2. Andrew
      1. Δx = unknown
      2. a = -8.8 m/s^2
      3. Initial Velocity = 45 m/s
      4. Δt = 5.1 seconds
      5. Answer: 120 meters
  6. Neither person will make it to work the next day because the required stopping distance is more than the given distances.
    Screenshot 2023-09-15 5.34.34 PM.png
    Sideways05.jpg
 

Attachments

  • Screenshot 2023-09-15 5.34.34 PM.png
    Screenshot 2023-09-15 5.34.34 PM.png
    15.2 KB · Views: 104
Last edited by a moderator:
Physics news on Phys.org
I agree with your numbers and conclusions. However your plot is not worth much without labels explaining what is what.
 
  • Like
Likes   Reactions: MatinSAR
Labels for the lines? I'm a bit confused on what to label.
 
Label the axes with what variables including units and the lines to distinguish which of the two cars are what color. If you have plotted velocity on the vertical axis and time on the horizontal axis, then you need to explain the negative time ##t=-3.187## s which, by the way, has too many sig figs as does the other time.

It seems that you have problems with what happens when ##t =0##. Conventionally, ##t=0## is when each car starts braking. Look at the blue line. It shows that as time increases, the speed increases because the velocity is positive and moves away from zero. That cannot be because supposedly the car is braking. Both lines should start on the vertical axis and there shouod be nothing to the left of it.

By the way, the stopping distance is quickly found using the kinematic equation $$2ax=v_{\!f}^2-v_{\!0}^2.$$
 
  • Like
Likes   Reactions: MatinSAR
Given the speeds involved and the short distance to the accident before they noticed it, both drivers were guilty of careless driving!
 
  • Like
Likes   Reactions: MatinSAR
A few additional thoughts...

valleyldp said:
Sarah
  1. Δx = unknown
  2. a = -9.1 m/s^2
  3. Initial Velocity = 29 m/s
  4. Δt = 3.2 seconds
  5. Answer: 46 meters

valleyldp said:
    1. Andrew
      1. Δx = unknown
      2. a = -8.8 m/s^2
      3. Initial Velocity = 45 m/s
      4. Δt = 5.1 seconds
      5. Answer: 120 meters
You have given both accelerations as negative. That conflicts with what you said ealier.

You have given both initial velocities as positive.. That conflicts with what you said ealier.

valleyldp said:
Your drawing shows a large gap between the 35m and 20m lengths. There should be no gap Also, the drawing doesn't clearly show the directions for east and west vectors. Add arrows,

But the main fault is with the graph, as already been explained by @kuruman in Post #4.
 
  • Like
Likes   Reactions: MatinSAR
I have fixed all the things that have been suggested. My new graph is posted below. Does it look better?

Note - I couldn't figure out how to get desmos to round the x-intercept, so I just recalculated the line equations to cross the y-axis at exactly 3.2 and 5.1. Does this work?
 
valleyldp said:
I have fixed all the things that have been suggested. My new graph is posted below. Does it look better?

Note - I couldn't figure out how to get desmos to round the x-intercept, so I just recalculated the line equations to cross the y-axis at exactly 3.2 and 5.1. Does this work?
Screenshot 2023-09-16 10.07.15 AM.png


I also added the constant velocity that happened before the acceleration started.
 
valleyldp said:
View attachment 332025

I also added the constant velocity that happened before the acceleration started.
One initial velocity is positive and the other one is negative (because the directions are opposite). But your graph shows both as positive.

One acceleration is positive and the other one is negative (do you see why?). But your graph shows both as negative. (The gradient of a v-t graph equals acceleration; the gradients of both of your lines (for t>0) are negative).
 
  • Like
Likes   Reactions: MatinSAR and Lnewqban
  • #10
In my model one acceleration is positive and the other is negative, but I couldn't figure out how to make a graph that would properly include both of these, so for simplicities sake I made both of them have negative acceleration and positive velocity. Do you have any idea how I could do it the correct way?
 
  • #11
I got it I think....would it look like this?
 

Attachments

  • Screenshot 2023-09-16 12.47.52 PM.png
    Screenshot 2023-09-16 12.47.52 PM.png
    17.8 KB · Views: 100
  • Like
Likes   Reactions: Steve4Physics and Lnewqban
  • #12
valleyldp said:
I got it I think....would it look like this?
Exactly. Good job!
 
  • Like
Likes   Reactions: MatinSAR
  • #13
Awesome! Thank you all for your help!
 
  • Like
Likes   Reactions: Steve4Physics and Lnewqban
  • #14
I have added the times (gray bars) when each driver collides with the pileup. Sarah will hit the pile up at about 30 mph and Andrew at about 90 mph. It looks like Andrew will take an early retirement from his job ##~\dots~## in the morgue.

CollisionCourse.png
 
  • Like
  • Haha
Likes   Reactions: Steve4Physics, MatinSAR and valleyldp

Similar threads

  • · Replies 5 ·
Replies
5
Views
1K
  • · Replies 2 ·
Replies
2
Views
1K
  • · Replies 2 ·
Replies
2
Views
3K
  • · Replies 2 ·
Replies
2
Views
2K
Replies
4
Views
3K
  • · Replies 16 ·
Replies
16
Views
4K
  • · Replies 11 ·
Replies
11
Views
6K
  • · Replies 29 ·
Replies
29
Views
3K
Replies
7
Views
2K
  • · Replies 7 ·
Replies
7
Views
1K