- #1
rof
- 4
- 0
hello guys,
i have a question and looking for an answer quickly...
question;
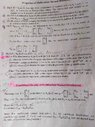
prove that,

Z is a vector.thank you.
i have a question and looking for an answer quickly...
question;
prove that,
Z is a vector.thank you.