Draw the sample space & find the probabilty

In summary, the grid allows for only a limited number of outcomes, and the sample space looks different without replacement.
  • #1
mathlearn
331
0
View attachment 6124

Having trouble in drawing the sample space in the grid :D
 

Attachments

  • New Document 57-Page 1.jpg
    New Document 57-Page 1.jpg
    59.8 KB · Views: 70
Mathematics news on Phys.org
  • #2
mathlearn said:
Having trouble in drawing the sample space in the grid :D

Hey mathlearn! ;)

Each intersection of dotted lines corresponds with a set of possible 2 bangles.
If they are the same color, the outcome is that the girl wears them - let's abbreviate that with 'w'.
If they are of different colors, the outcome is that the girl does not wear them - abbreviated 'n'.

Put the letters 'w' and 'n' at the intersections and presto!
We have our sample space representing all possible outcomes. (Happy)
 
  • #3
I like Serena said:
Hey mathlearn! ;)

Each intersection of dotted lines corresponds with a set of possible 2 bangles.
If they are the same color, the outcome is that the girl wears them - let's abbreviate that with 'w'.
If they are of different colors, the outcome is that the girl does not wear them - abbreviated 'n'.

Put the letters 'w' and 'n' at the intersections and presto!
We have our sample space representing all possible outcomes. (Happy)

Hey ILS ;)

I updated the sample space grid

View attachment 6131

Correct ? :)
 

Attachments

  • New Document 57-Page 1.jpg
    New Document 57-Page 1.jpg
    20 KB · Views: 63
  • #4
mathlearn said:
Hey ILS ;)

I updated the sample space grid

Correct ? :)

Yep. (Nod)
 
  • #5
Not quite. Remember that she does not return the first bangle to the drawer before she draws the second! Because of that, (W1, W1), (W2, W2), (W3, W3), (B1, B1), and (B2, B2) are not in the sample space. Those points should not be marked at all. Instead of having 5*5= 25 points in the sample space there are 25- 5= 20 (the -5 from the diagonal points that are removed). Instead of 3^2+ 2^2= 9+ 4= 13 "W"s there are 13- 5= 8 "W"s.
 
  • #6
mathlearn said:
Having trouble in drawing the sample space in the grid :D
The grid is misleading.
The earrings are drawn without replacement,
There are [tex]5\cdot4 = 20[/tex] outcomes, not 25.

[tex]\begin{array}{cccc}W_1W_2 & W_1W_3 & W_1B_1 & W_1B_2 \\
W_2W_1 & W_2W_3 & W_2B_1 & W_2B_2 \\
W_3W_1 & W_3W_2 & W_3B_1 & W_3B_2 \\
B_1W_1 & B_1W_2 & B_1W_3 & B_1B_2 \\
B_2W_1 & B_2W_2 & B_2W_3 & B_2B_1
\end{array}[/tex]
.
 

What is a sample space?

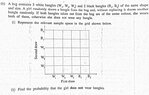
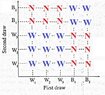
A sample space is the set of all possible outcomes of an experiment or event. It is denoted by the symbol S and can be represented using a list, table, or diagram.

How do you draw a sample space?

To draw a sample space, you first need to identify all possible outcomes of the experiment or event. Then, organize these outcomes in a logical manner, such as in a list or diagram. Make sure to include all possible combinations and outcomes.

What is the difference between a sample space and an event?

A sample space is the set of all possible outcomes, while an event is a subset of the sample space that represents a specific outcome or combination of outcomes. In other words, the event is a specific occurrence within the sample space.

How do you calculate the probability of an event?

To calculate the probability of an event, you need to divide the number of outcomes in the event by the total number of outcomes in the sample space. This can be represented as P(event) = (# of outcomes in event) / (# of outcomes in sample space).

What is the difference between theoretical and experimental probability?

Theoretical probability is based on mathematical calculations and assumes that all outcomes are equally likely. Experimental probability is based on actual data and the observed frequency of an event occurring. As more data is collected, the experimental probability tends to approach the theoretical probability.

Similar threads

  • General Math
Replies
3
Views
1K
Replies
14
Views
1K
Replies
1
Views
762
Replies
12
Views
996
  • Set Theory, Logic, Probability, Statistics
Replies
9
Views
564
  • Set Theory, Logic, Probability, Statistics
Replies
13
Views
2K
Replies
7
Views
1K
  • Set Theory, Logic, Probability, Statistics
Replies
5
Views
504
  • Set Theory, Logic, Probability, Statistics
Replies
6
Views
1K
  • Set Theory, Logic, Probability, Statistics
Replies
9
Views
1K
Back
Top