F-Test Probability: Calculate & Test Hypothesis | 1977 Observations

  • MHB
  • Thread starter iiownz
  • Start date
In summary: This equation is commonly used in statistical hypothesis testing to determine the significance of a regression model. In summary, the F-test statistic for this equation is calculated by taking the ratio of the explained variance to the unexplained variance, with degrees of freedom equal to p and n-p-1. This is a commonly used equation in statistical hypothesis testing for regression models.
  • #1
iiownz
1
0
Hello guys!

I've been trying to solve this exercise for a long time. I know that is not that dificult.

However i can't remember how to do it.Thanks in advance.

View attachment 9510

Question
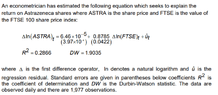
Calculate the F-test statistic for this equation and use it to perform a test for the null hypothesis that the slope coefficient is equal to zero
Ho = 0
H1 not equal to 0

1977 observations.

I found this relation between the R-squared and the F-test. Where does it come from? I have never heard about it. Also, how many degrees of freedom should i use for that test?

F= (R^2/(p-1))/((1-R^2)/(n-p)) -- Is this right? because it seems that some authors have been using F (p, n-p-1) as degrees of freedom. I am not sure which one is right.

Thanks!
 

Attachments

  • 1574729370087.png
    1574729370087.png
    31 KB · Views: 56
Physics news on Phys.org
  • #2
The F-test statistic for this equation is calculated by taking the ratio of the explained variance (R-squared) to the unexplained variance (1 - R-squared). The numerator of this ratio is the explained variance, and the denominator is the unexplained variance. The degrees of freedom to use for the F-test are p, the number of explanatory variables in the model, and n-p-1, the number of observations minus the number of explanatory variables. Therefore, in this case, the F-test statistic is equal to F(p, n-p-1).
 

What is an F-test?

An F-test is a statistical test used to compare the variances of two or more groups of data. It is used to determine whether the differences between the groups are statistically significant.

How do you calculate F-test probability?

F-test probability is calculated by dividing the between-group variability by the within-group variability. This calculation results in an F-statistic, which is then compared to a critical value from an F-distribution to determine the probability.

What is the purpose of testing a hypothesis with an F-test?

The purpose of testing a hypothesis with an F-test is to determine whether there is a significant difference between the variances of two or more groups of data. This can help to identify any patterns or trends in the data and can also be used to make predictions about future observations.

What is the significance level in an F-test?

The significance level in an F-test is the probability of rejecting the null hypothesis when it is actually true. This is usually set at 0.05 or 0.01, meaning that there is a 5% or 1% chance of falsely rejecting the null hypothesis.

How many observations are needed for an F-test?

The number of observations needed for an F-test depends on the number of groups being compared and the desired power of the test. Generally, a larger sample size will result in a more accurate and reliable F-test.

Similar threads

  • Set Theory, Logic, Probability, Statistics
Replies
3
Views
1K
  • Set Theory, Logic, Probability, Statistics
Replies
1
Views
2K
  • Set Theory, Logic, Probability, Statistics
Replies
20
Views
3K
  • Set Theory, Logic, Probability, Statistics
Replies
5
Views
1K
  • Set Theory, Logic, Probability, Statistics
Replies
8
Views
2K
  • Set Theory, Logic, Probability, Statistics
Replies
7
Views
477
  • Set Theory, Logic, Probability, Statistics
Replies
26
Views
3K
  • Set Theory, Logic, Probability, Statistics
Replies
5
Views
2K
  • Set Theory, Logic, Probability, Statistics
Replies
1
Views
1K
  • Set Theory, Logic, Probability, Statistics
Replies
5
Views
2K
Back
Top