Generate a trackmap with speed and g forces

In summary, the person is trying to generate a track map from Speed and G-Forces data, but is stuck because they do not know how to calculate Ao. After some help from another user, they finish the task.
  • #1
Gwen49
5
2
Hello everyone,

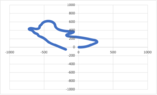
I hope you are all great. I am writing down to all of you concerning a problem of mine. I am struggling to generate a trackmap based on Speed (m/s) and G-Forces on excel.
I followed a topic created 12 years ago but unfortunately it is closed :
https://www.physicsforums.com/threads/draw-map-based-on-speed-and-g-forces.518628/

Attached you will find my row data, there is just the beginning of the lap to minimize the file's size, I would be so happy to get some explanations, we never learn enough :-)

Thank you very much!
 

Attachments

  • analyse-trackmap.xlsx
    2 MB · Views: 50
Physics news on Phys.org
  • #2
Welcome to PF.

It's best not to attach files that can contain macros, since those can pose security issues. It's better to post a PDF screenshot of your file, to give others an idea of what you are doing.

Is this for schoolwork, BTW? Or is it for your own personal racing and tuning?
 
  • #3
Thank you very much!

The file doesn’t contain macro, it’s a xlsx file.
In fact it’s just a file full a data no more, with car speed and g-lat forces.

From that, I would like to draw a track map.

This is for both! Thanks
 
  • #4
Gwen49 said:
The file doesn’t contain macro, it’s a xlsx file.
Excel files routinely contain macros; I've used them myself to automate various tasks in spreadsheets. There is no way to know if there are macros (good or bad) in an Excel file prior to opening it, AFAIK.

Gwen49 said:
This is for both!
Which both?
 
  • #6
In your Excel spreadsheet:
  • You are missing the time interval between each measurement;
  • Are you sure the lateral acceleration is in m/s²?
  • dA doesn't include the multiplication with the time interval;
  • Vx & Vy have the wrong angle (they all have 1 rad or 89 rad);
  • X & Y do not include the multiplication with the time interval either;
  • X & Y have the velocity Vx & Vy multiplied by sine and cosine and they shouldn't;
  • Might be better if X0 & Y0 both equal zero;
  • Your graphs are linked to external data.
Because of the large values for R, this looks like a vehicle going in a straight line.
 
  • #7
jack action said:
In your Excel spreadsheet:
  • You are missing the time interval between each measurement;
  • Are you sure the lateral acceleration is in m/s²?
  • dA doesn't include the multiplication with the time interval;
  • Vx & Vy have the wrong angle (they all have 1 rad or 89 rad);
  • X & Y do not include the multiplication with the time interval either;
  • X & Y have the velocity Vx & Vy multiplied by sine and cosine and they shouldn't;
  • Might be better if X0 & Y0 both equal zero;
  • Your graphs are linked to external data.
Because of the large values for R, this looks like a vehicle going in a straight line.
Jack, massive thanks for this deep analysis, I go back to work!
 
  • #8
After working today on it, I feel I am not too far away from the right result.
The thing is, I don't know how to figure Ao out. As I don't know Ao and A, I can't solve the equation. I feel like I am stuck.
Is there another way round to know my Ao ? As normally i should be able to draw a trackmap from G forces and Speed I guess there is something I don't get here
Thanks!
 

Attachments

  • analyse-trackmap.xlsx
    2.4 MB · Views: 67
  • #9
A is the angle of the car with respect to your X-Y plot. It is not the steering angle.
A0 is the initial value.

A1 = A0 + dA0
A2 = A1 + dA1
A3 = A2 + dA2
...

The same concept goes for X and Y.
 
  • #10
Jack,

Big big thanks for your crucial help. I manage to finish the tool I wanted to do.
You are a genius!

See you soon!
 

Attachments

  • pau excel.png
    pau excel.png
    7.1 KB · Views: 50
  • Like
Likes Juanda and jack action

1. How do you generate a trackmap with speed and g forces?

To generate a trackmap with speed and g forces, you will need to use specialized software or tools such as a data acquisition system or a racing simulator. These tools will collect data from sensors on the vehicle and create a visual representation of the track with speed and g force data.

2. What is the purpose of generating a trackmap with speed and g forces?

The purpose of generating a trackmap with speed and g forces is to analyze and understand the performance of the vehicle on a specific track. This can help engineers and drivers make improvements to the vehicle and optimize their driving techniques.

3. What factors affect the accuracy of a trackmap with speed and g forces?

The accuracy of a trackmap with speed and g forces can be affected by various factors such as the quality of the sensors used, the positioning of the sensors on the vehicle, and the precision of the data acquisition system or racing simulator being used.

4. Can a trackmap with speed and g forces be used for different types of vehicles?

Yes, a trackmap with speed and g forces can be used for different types of vehicles such as cars, motorcycles, and even bicycles. However, the type of data collected and the accuracy of the trackmap may vary depending on the capabilities of the vehicle and the sensors being used.

5. How can a trackmap with speed and g forces be used to improve vehicle performance?

A trackmap with speed and g forces can provide valuable insights into the performance of a vehicle on a specific track. By analyzing the data, engineers and drivers can identify areas for improvement and make adjustments to the vehicle or driving techniques to optimize performance and achieve better lap times.

Similar threads

Replies
24
Views
2K
Replies
9
Views
1K
Replies
6
Views
2K
  • Mechanical Engineering
Replies
1
Views
1K
Replies
11
Views
2K
Replies
2
Views
1K
Replies
6
Views
466
  • Mechanics
Replies
8
Views
2K
Back
Top