How to calculate dark count from data collected?

In summary, the conversation discusses the measurement of dark count from a SPDC source and the data collected from the signal generator. Dark counts are defined as a tiny amount of DC current in the absence of light input and can limit single photon detection capability. The data includes detection rates for channel 2 (Ch2) and channel 4 (Ch4), coincidence rates, and delay times. The graphs generated from the data do not make sense to the speaker, and they are seeking insights on how to calculate the dark count. There is no light source in the setup, but the Ch2 counts are non-zero, leading to questions about what is producing these counts. The setup and inputs are not described, and the purpose of the measurements is unclear
  • #1
physicsclaus
20
5
Homework Statement
How to calculate dark count from data collected?
Relevant Equations
I cannot find it
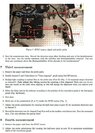
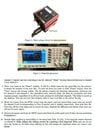
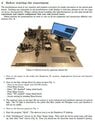
Hello everyone, I am trying to measure the dark count from a measurement a SPDC source. Although I collected data from the signal generator, I do not know how to obtain dark count rates per second.

I only know the following definition
Dark counts refer to the tiny amount of DC current in the absence of light input. An additional fluctuating current with zero mean value caused by thermal fluctuation is not called a dark current. When extremely small optical powers need to be detected, we need to consider dark count. Thus, dark count will limit single photon detection capability.

The following is the data extracted:
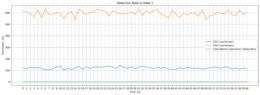
Detection rate ch.2 (counts/s): 124
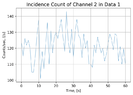
Detection rate ch.4 (counts/s): 612
Coincidence rate (pairs/s): 0
Delay (ns): 0

Delay (ns), Coincidence rate (pairs/sec)

-20, 0
-18, 0
-16, 0
-14, 0
-12, 0
-10, 0
-8, 0
-6, 0
-4, 0
-2, 0
0, 0
2, 0
4, 0
6, 0
8, 0
10, 0
12, 0
14, 0
16, 0
18, 0
20, 0

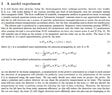
Time (s), Ch2 (counts/sec), Ch4 (counts/sec), Coincidence (pairs/sec) (delay: 0 ns)

0, 124, 612, 0
1, 115, 609, 0
2, 126, 589, 0
3, 122, 564, 0
4, 125, 627, 0
5, 120, 555, 0
6, 105, 630, 0
7, 105, 584, 0
8, 115, 586, 0
9, 128, 604, 0
10, 138, 597, 0
11, 101, 548, 0
12, 118, 596, 0
13, 107, 611, 0
14, 122, 538, 0
15, 136, 632, 0
16, 110, 609, 0
17, 131, 582, 0
18, 117, 602, 0
19, 127, 605, 0
20, 130, 632, 0
21, 126, 621, 0
22, 132, 617, 0
23, 138, 574, 0
24, 127, 615, 0
25, 118, 605, 0
26, 143, 588, 0
27, 125, 594, 0
28, 117, 594, 0
29, 132, 608, 0
30, 114, 586, 0
31, 130, 632, 0
32, 138, 576, 0
33, 128, 619, 0
34, 126, 601, 0
35, 114, 613, 0
36, 129, 631, 0
37, 120, 586, 0
38, 125, 576, 0
39, 110, 551, 0
40, 110, 624, 0
41, 108, 587, 0
42, 122, 562, 0
43, 117, 597, 0
44, 127, 580, 0
45, 122, 600, 0
46, 117, 598, 0
47, 120, 569, 0
48, 112, 628, 0
49, 116, 540, 0
50, 123, 574, 0
51, 129, 579, 0
52, 126, 606, 0
53, 119, 594, 0
54, 129, 590, 0
55, 128, 629, 0
56, 112, 584, 0
57, 121, 574, 0
58, 110, 624, 0
59, 120, 586, 0
60, 110, 602, 0

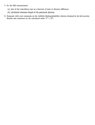
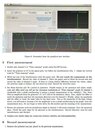
I generated some graphs from jupyter notebook, still it does not make sense to me.

I have also found the respective maximum values
Time (s) 60
Ch2 (counts/sec) 143
Ch4 (counts/sec) 632
Coincidence (pairs/sec) (delay:6ns) 0
dtype: int64

and also the respective mean values
Time (s) 30.000000
Ch2 (counts/sec) 121.508197
Ch4 (counts/sec) 595.508197
Coincidence (pairs/sec) (delay:6ns) 0.000000
dtype: float64

I hope someone could give me some insights of how to calculate the dark count, thank you so much for your time!
 

Attachments

  • allchanneldata1.png
    allchanneldata1.png
    10.4 KB · Views: 70
  • channel2data1.png
    channel2data1.png
    24.6 KB · Views: 59
  • channel4data1.png
    channel4data1.png
    25.1 KB · Views: 70
Last edited:
  • Like
Likes yucheng
Physics news on Phys.org
  • #2
Were the Ch2 measurements taken with no light source?
 
  • Like
Likes Steve4Physics and physicsclaus
  • #3
Drakkith said:
Were the Ch2 measurements taken with no light source?
Yes, there is no light source in it .
 
  • Like
Likes Steve4Physics
  • #4
physicsclaus said:
Yes, there is no light source in it .
Since there is no light source producing the Ch2 readings, why do you think the Ch2 counts are non-zero? What is producing the Ch2 counts?

You haven't provided any description of the setup. We are left to guess! What are the inputs to Ch2 and Ch4? Are the efficiencies of Ch2 and Ch4 identical? What coincidences are being detected? Why do the results show zero coincidences? Is the sole purpose to measure the dark count rate or is there some other objective? Etc.
 
  • Like
Likes physicsclaus
  • #5
physicsclaus said:
Yes, there is no light source in it .
Then are the Ch2 counts/s not already the dark current/s? I'm not sure what your setup is, what sensors you're using, etc. For a CCD or CMOS camera sensor, I would take a 'dark frame', subtract the built-in bias via a bias frame, and then divide by the exposure time to get dark current per second for each pixel. I'm not quite sure how this works for a DC current from whatever your sensor is.
 
  • Like
Likes physicsclaus and berkeman
  • #6
Steve4Physics said:
Since there is no light source producing the Ch2 readings, why do you think the Ch2 counts are non-zero? What is producing the Ch2 counts?

You haven't provided any description of the setup. We are left to guess! What are the inputs to Ch2 and Ch4? Are the efficiencies of Ch2 and Ch4 identical? What coincidences are being detected? Why do the results show zero coincidences? Is the sole purpose to measure the dark count rate or is there some other objective? Etc.
Now I understand more why there is dark count measured in the photodetector. as far as I know, the photon light signal is converted into current so we can measure it. how the As you mentioned efficiency, do you know a way to calculate it? For the coincidence, I think it is due to the blockage of the output from the SPDC source with paper card so we cannot measure it. I should have mentioned this part. I have many measurements in this experiment, the first one is to measure the dark count. Thank you for your questions for clarity.
 
  • #7
Drakkith said:
Then are the Ch2 counts/s not already the dark current/s? I'm not sure what your setup is, what sensors you're using, etc. For a CCD or CMOS camera sensor, I would take a 'dark frame', subtract the built-in bias via a bias frame, and then divide by the exposure time to get dark current per second for each pixel. I'm not quite sure how this works for a DC current from whatever your sensor is.
Channel 2 corresponds to the probe and channel 4 correspond to the system. I do not know what sensor is this either. Thank you so much for your method of finding the dark count.
 
  • #8
physicsclaus said:
Channel 2 corresponds to the probe and channel 4 correspond to the system. I do not know what sensor is this either.
Where is the probe? What does the system consist of?

Consider providing a diagram of the setup showing clearly where the Ch2 and Ch4 signals come from. What is(are) the objective(s) of the experiment? Do you have an instruction sheet? Can you post it?
 
  • #9
Please kindly find all the images about the experiment. Can I ask questions other than dark count? I feel this experiment is so difficult for me complete.
 

Attachments

  • B2FDFEC8-470D-496F-BE0A-32C6CC777CA9.jpg
    B2FDFEC8-470D-496F-BE0A-32C6CC777CA9.jpg
    70.8 KB · Views: 62
  • 942F0D7C-0937-4313-8EEB-33C0E8BD6984.jpg
    942F0D7C-0937-4313-8EEB-33C0E8BD6984.jpg
    8.6 KB · Views: 79
  • 391327DB-D5D4-40C9-814E-E02D3B60ED45.jpg
    391327DB-D5D4-40C9-814E-E02D3B60ED45.jpg
    64.2 KB · Views: 68
  • 155FDF47-7B61-4368-AECE-E2E9B1B93FAB.jpg
    155FDF47-7B61-4368-AECE-E2E9B1B93FAB.jpg
    65.9 KB · Views: 72
  • 16F34BE4-0EDA-4B2C-A07C-A333C85DE49C.jpg
    16F34BE4-0EDA-4B2C-A07C-A333C85DE49C.jpg
    56.2 KB · Views: 56
  • BBFE48B8-66D3-4E92-9C46-85EC347210BA.jpg
    BBFE48B8-66D3-4E92-9C46-85EC347210BA.jpg
    58.6 KB · Views: 64
  • BEFE89D0-80D5-4442-A567-2360CACB576B.jpg
    BEFE89D0-80D5-4442-A567-2360CACB576B.jpg
    48.7 KB · Views: 60
  • A7C6B39E-CFA4-4195-AB2C-1156936BA88B.jpg
    A7C6B39E-CFA4-4195-AB2C-1156936BA88B.jpg
    57 KB · Views: 61
  • 3EB91AC5-4175-4DDD-B2F0-79A5C39FB00B.jpg
    3EB91AC5-4175-4DDD-B2F0-79A5C39FB00B.jpg
    69.2 KB · Views: 67
  • #10
physicsclaus said:
Please kindly find all the images about the experiment. Can I ask questions other than dark count? I feel this experiment is so difficult for me complete.
The images of the text you posted seem to be in a random order without page numbers. I’ve looked through them and they seem to include Sections 2 -10 (but in random order) of some document - but there is no Section 1. Maybe Section 1 pulls the whole thing together.

This seems to be some sort of quantum entanglement/erasure/delayed-choice experiment, or similar. But I can’t see any clear statement of the overall objective/purpose.

There are a number of very specific steps to follow – your best bet might be to try following them and see what happens. Then the overall picture might become clearer.

I’m not knowledgeable in this area so it’s very difficult (for me, anyway) to offer any specific advice. Sorry I can’t help more.

[minor edit]
 
Last edited:
  • Like
Likes vanhees71 and physicsclaus
  • #11
Okay, according to section 3, the 'probe' is simply one set of photons exiting the 2nd beamsplitter in port B, while the 'system' is the other set of photons exiting the 2nd beamsplitter in port A. So each photon pair is split into a probe photon and a system photon. Each photon beam is detected by its own separate detector.

I have zero experience with this, but I would think you would simply measure the output from each detector without the photon source turned on to get the dark current. Although if you already did this above then I don't know why Ch2 and Ch4 have wildly different counts unless they are different types or brands of detectors.
 
  • Like
Likes vanhees71

1. What is dark count?

Dark count refers to the number of false signals or noise detected by a device, such as a photomultiplier tube, in the absence of any actual light input. It is a measure of the inherent noise or background signal in the system.

2. Why is it important to calculate dark count?

Calculating dark count allows us to understand the baseline noise level in our system and account for it in our data analysis. It is especially important in low light experiments where the signal of interest may be close to or even below the level of dark count.

3. How is dark count calculated?

Dark count is typically calculated by taking measurements with no light input and averaging the number of counts over a period of time. This average is then subtracted from the total counts in subsequent measurements to account for the dark count.

4. What factors can affect dark count?

The dark count can be affected by various factors such as temperature, voltage, and the type and condition of the detector. Higher temperatures and voltages can increase the dark count, while using a newer or more sensitive detector can decrease it.

5. How can dark count be minimized?

Dark count can be minimized by optimizing the experimental setup, such as using lower temperatures and voltages, and using a high-quality, well-maintained detector. Additionally, subtracting a dark count measurement from subsequent data can help reduce the impact of dark count on the final results.

Similar threads

  • Programming and Computer Science
Replies
2
Views
2K
Back
Top