- #1
chriskeller1
- 6
- 0
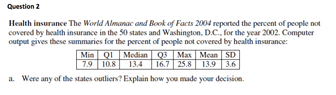
Hi guys, I'm getting ready for a stats exam and one of the questions looks like this
View attachment 3406
If I'm not given a histogram, how can this be solved?
View attachment 3406
If I'm not given a histogram, how can this be solved?