What are the positive values for a in the equation a^x=x+2?

  • MHB
  • Thread starter Vali
  • Start date
In summary, the equation a^x=x+2 has two real solutions, which can be found by examining the concavity of the function f(x)=a^x-x-2 and using the Lambert W function.
  • #1
Vali
48
0
Sorry for posting again but I need to prepare for exam.
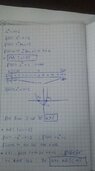
a^x=x+2 has two real solutions.I need to find positive values for "a".
A) (1, infinity)
B) (0,1)
C) (1/e , e)
D) (1/(e^e), e^e)
E) (e^(1/e), infinity)
I tried to solve and I did it but I don't understand some things.
I let a picture below to see.
First, I need to know if there's other way to solve this kind of exercise.I would be happy if I would get some ideas.
Also, from my solution, I don't understand why from that table results just one solution and from the graphic results two solutions.Usually, to see the number of solutions I use this kind of table.
For a>1 f decrease from infinity to -1, then increase from -1 to infinity.I'm really confused.Need some indications here.
Thank you!
 

Attachments

  • expo.jpg
    expo.jpg
    42.5 KB · Views: 63
Last edited:
Mathematics news on Phys.org
  • #2
I would begin with:

\(\displaystyle f(x)=a^x-x-2\)

Hence, let's examine:

\(\displaystyle f'(x)=a^x\ln(a)-1\)

\(\displaystyle f''(x)=a^x\ln^2(a)\)

Now, in order for \(f(x)\) to have 2 roots, we require upward concavity, that is we require:

\(\displaystyle f''(x)<0\)

Can you finish?
 
  • #3
Hi Vali,

You have a mistake for $a<1$ where you took the example $a=-e$.
Admittedly $-e < 1$, but $a^x$ is not defined for negative $a$.
So we should pick $0<a<1$. We can pick for instance $a=\frac 1e$ so that we get $a^x=(\frac 1e)^x = e^{-x}$.

To understand better what's going on, let's draw a couple of graphs.

\begin{tikzpicture}[scale=0.6]
\begin{scope}
\draw[help lines] (-4,-2) grid (4,5);
\draw[<->] (-4.4,0) -- (4.4,0) node
{$x$};
\draw[<->] (0,-2.2) -- (0,5.2) node[above] {$y$};
\draw foreach \i in {-4,-3,-2,-1,1,2,3,4} { (\i,0.1) -- (\i,-0.1) node[below] {$\i$} };
\draw foreach \i in {-2,-1,1,2,3,4,5} { (0.1,\i) -- (-0.1,\i) node
{$\i$} };
\draw[domain=-4:2.2, variable=\x, red, ultra thick] plot ({\x}, {(\x+2)}) node
{$y=x+2$};
\draw[domain=-4:1.6, variable=\x, blue, ultra thick] plot ({\x}, {exp(\x)}) node
{$y=a^x, a>1$};
\end{scope}
\begin{scope}[xshift=10cm]
\draw[help lines] (-4,-2) grid (4,5);
\draw[<->] (-4.4,0) -- (4.4,0) node
{$x$};
\draw[<->] (0,-2.2) -- (0,5.2) node[above] {$y$};
\draw foreach \i in {-4,-3,-2,-1,1,2,3,4} { (\i,0.1) -- (\i,-0.1) node[below] {$\i$} };
\draw foreach \i in {-2,-1,1,2,3,4,5} { (0.1,\i) -- (-0.1,\i) node
{$\i$} };
\draw[domain=-4:2.2, variable=\x, red, ultra thick] plot ({\x}, {(\x+2)}) node[above] {$y=x+2$};
\draw[domain=-4:3, variable=\x, blue, ultra thick] plot ({\x}, {1}) node[above] {$y=a^x, a=1$};
\end{scope}
\begin{scope}[xshift=20cm]
\draw[help lines] (-4,-2) grid (4,5);
\draw[<->] (-4.4,0) -- (4.4,0) node
{$x$};
\draw[<->] (0,-2.2) -- (0,5.2) node[above] {$y$};
\draw foreach \i in {-4,-3,-2,-1,1,2,3,4} { (\i,0.1) -- (\i,-0.1) node[below] {$\i$} };
\draw foreach \i in {-2,-1,1,2,3,4,5} { (0.1,\i) -- (-0.1,\i) node
{$\i$} };
\draw[domain=-4:2.2, variable=\x, red, ultra thick] plot ({\x}, {(\x+2)}) node
{$y=x+2$};
\draw[domain=-1.6:3, variable=\x, blue, ultra thick] plot ({\x}, {exp(-\x)}) node[above right] {$y=a^x, 0<a<1$};
\end{scope}
\end{tikzpicture}

Note that the line $y=x+2$ intersects the y-axis at $2$, which is always above the $1$ where $y=a^x$ intersects the y-axis.
The cases are:
  • For $a>1$, the graph of $y=a^x$ always slopes upwards exponentially so that it will always overtake the line.
    In other words, we always have 2 intersection points.
  • For $a=1$ we have indeed always 1 intersection point as we have 2 intersecting lines.
  • For $0<a<1$ we also have always 1 intersection point since the graphs have opposite slopes.
    As you can see, this is different from what you had, as $a$ must be positive for a proper definition of $a^x$.
  • For $a=0$ (not drawn) $a^x$ is only defined for positive $x$ where it is $0$, so no intersection points.
    We can't divide by $0$ after all.
  • For $a<0$ the expression $a^x$ is undefined for real $x$. We can't take roots (at e.g. $x=\frac 12$) of negative numbers after all.
I hope this clarifies a bit and gives you a different way to look at the problem! ;)​
 
  • #4
Thank you for your help!I understood.

I try to understand the method with second derivative.
f''(x) < 0 has no solution for x real.
 
  • #5
By the way, letting y= x+ 2, the equation becomes

\(\displaystyle a^{y-2}= a^{-2}a^y= a^{-2}e^{ln(a^y)}= a^{-2}e^{yln(a)}= y\).

Letting z= y ln(a), [tex]a^{-2}e^{z}= \frac{z}{ln(a)}[/tex]. [tex]ze^{-z}= a^{-2}ln(a)[/tex]. Finally, letting u= -z, [tex]ue^u= -a^{-2}ln(a)[/tex]. Then [tex]u= W(-a^{-2}ln(a))[/tex] where W is "Lambert's W function", the inverse to [tex]f(x)= xe^x[/tex].

Then [tex]z= -W(-a^{-2}ln(a))[/tex], [tex]y= -\frac{W(-a^{-2}ln(a))}{ln(a)}[/tex], [tex]x= -\frac{W(-a^{-2}ln(a))}{ln(a)}- 2[/tex].

Of course, since the W function can be multivalued, that does not answer the original question!
 

1. What is the Indications Equation?

The Indications Equation is a mathematical equation that involves an unknown variable, represented by the letter x, and a constant, represented by the letter a. It is written in the form a^x=x+2.

2. What are the possible solutions for the Indications Equation?

The Indications Equation has multiple possible solutions, which can be found by graphing or using algebraic methods. These solutions can be real numbers or complex numbers.

3. How is the Indications Equation used in science?

The Indications Equation is commonly used in science to model various natural phenomena, such as population growth, radioactive decay, and chemical reactions. It can also be used to solve problems involving exponential growth or decay.

4. What is the significance of the constant a in the Indications Equation?

The constant a in the Indications Equation represents the base of the exponential function. It determines the rate at which the function grows or decays. A larger value for a will result in a steeper graph, while a smaller value will result in a flatter graph.

5. How can the Indications Equation be solved?

The Indications Equation can be solved by using logarithms, which allow us to isolate the variable x. It can also be solved graphically by finding the points of intersection between the two curves. Additionally, numerical methods such as Newton's method can be used to approximate the solutions of the equation.

Similar threads

Replies
3
Views
448
  • General Math
Replies
5
Views
870
Replies
4
Views
1K
  • General Math
Replies
22
Views
566
Replies
1
Views
876
Replies
3
Views
1K
Replies
2
Views
1K
  • General Math
Replies
4
Views
1K
Replies
5
Views
2K
Back
Top