Market graph increasing, decreasing and bouncing

In summary, if you need to determine if the market is increasing or decreasing at a certain point, you can use the percent change formula. To measure market volatility or bouncing, there are various formulas and indicators available, and there are also programming libraries and tools that can assist with data analysis and extraction. Some popular options include Pandas, NumPy, and Bloomberg. Good luck with your development!
  • #1
adska
3
0
I am developing a market trade bot and need to extract some parameters from market data but I don't have idea how to do it exactly. need your help.

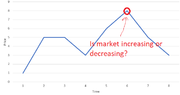
1) How to reproduce if market is increasing or decreasing at certain point? (ex. see below picture)

View attachment 9558

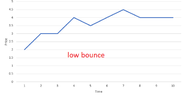
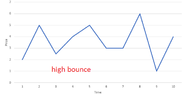
2) Does exist any formula how to reproduce index or something which would show how strongly market price is bouncing? it means if there are huge price spikes in short time then bouncing is big, if price spikes or not high or rare in time then bouncing is not high. (ex. see below pictures)

View attachment 9559

View attachment 9560

Thanks for any help, any programming libraries or tools which would help to solve these problems are welcome too.
 

Attachments

  • 1.png
    1.png
    4.6 KB · Views: 59
  • 2.png
    2.png
    2.5 KB · Views: 53
  • 3.png
    3.png
    4.5 KB · Views: 52
Mathematics news on Phys.org
  • #2


Hello,

Thank you for reaching out for help with your market trade bot. I have experience with analyzing market data and can provide some guidance on how to extract parameters from it.

1) To determine if the market is increasing or decreasing at a certain point, you can use a simple formula called the percent change. This is calculated by taking the difference between the current price and the previous price, and dividing it by the previous price. If the result is positive, it means the market is increasing, and if it is negative, it means the market is decreasing. You can set a threshold to determine what constitutes a significant increase or decrease.

2) There are several formulas that can be used to measure market volatility or bouncing. One common metric is the standard deviation, which measures the spread of data points around the mean. A higher standard deviation would indicate higher bouncing in the market. Another metric is the average true range, which takes into account the range of price movements over a certain period of time. There are also various technical indicators that can be used to measure volatility, such as Bollinger Bands or the Relative Strength Index (RSI).

As for programming libraries or tools, there are many available that can help with market data analysis and parameter extraction. Some popular ones include Pandas, NumPy, and SciPy. These libraries offer a wide range of functions and methods for data manipulation and analysis. Additionally, there are also platforms and APIs specifically designed for market data analysis, such as Bloomberg, Yahoo Finance, and Alpha Vantage.

I hope this helps you in your development process. Please feel free to reach out if you have any further questions or need more specific guidance. Good luck with your market trade bot!
 

1. What is a market graph?

A market graph is a visual representation of the performance of a particular market or stock over a period of time. It typically shows the price or value of the market or stock on the vertical axis and time on the horizontal axis.

2. What does it mean when a market graph is increasing?

When a market graph is increasing, it means that the value of the market or stock is rising over time. This could be due to a variety of factors, such as increased demand for the product or positive news about the company.

3. What causes a market graph to decrease?

A market graph can decrease for a number of reasons, such as a decrease in demand for the product, negative news about the company, or a general downturn in the market. It can also be influenced by external factors such as economic conditions or political events.

4. What is a bouncing market graph?

A bouncing market graph is one that shows a pattern of both increasing and decreasing values over a period of time. This could indicate that the market or stock is experiencing a period of volatility, with fluctuations in price due to various factors.

5. How can market graphs be used for analysis?

Market graphs can be used by analysts and investors to track the performance of a market or stock and make informed decisions about buying or selling. They can also be used to identify trends and patterns that may help predict future movements in the market.

Similar threads

  • General Math
Replies
1
Views
1K
Replies
1
Views
640
Replies
4
Views
3K
  • Computing and Technology
Replies
2
Views
1K
  • Calculus and Beyond Homework Help
Replies
11
Views
1K
Replies
6
Views
2K
  • Aerospace Engineering
Replies
24
Views
2K
Replies
2
Views
839
Replies
6
Views
2K
  • Introductory Physics Homework Help
Replies
6
Views
321
Back
Top