Noelia's question at Yahoo Answers regarding use of a Venn diagram

In summary, 23 students received a certificate in only one area and 8 students received certificates in only two areas.
  • #1
MarkFL
Gold Member
MHB
13,288
12
Here is the question:

Please help you must draw Venn diagrams and solve with equation, but I can't seem to get the answers!

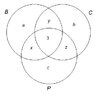
There is a seminar in which 34 students participated. Every student got a certificate, 14 in biology, 13 in chemistry and 21 in physics, and only 3 students got all three certificates. How many got certificates in only one area and how got certificates in only two areas?? Please help you must draw Venn diagrams and solve with equation but i can't seem to get the answers

I have posted a link there to this topic so the OP can see my work.
 
Mathematics news on Phys.org
  • #2
Hello Noelia,

First, let's draw the Venn diagram:

View attachment 1144

The set $B$ represents those students who got a certificate in biology, $C$ represents those students who got a certificate in chemistry, and $P$ represents those students who got a certificate in physics.

We are told the cardinality of set $B$ is 14, so we may write:

\(\displaystyle a+x+y+3=14\implies a=11-(x+y)\)

We are told the cardinality of set $C$ is 13, so we may write:

\(\displaystyle b+y+z+3=13\implies b=10-(y+z))\)

We are told the cardinality of set $P$ is 21, we we may write:

\(\displaystyle c+x+z+3=21\implies c=18-(x+z))\)

Hence, the number of students that received only 1 certificate is:

\(\displaystyle a+b+c=39-2(x+y+z)\)

The number of students that received 2 certificates is:

\(\displaystyle x+y+z\)

And we are told the the number of students that received 3 certificates is:

\(\displaystyle 3\)

The sum of these is 34, since we are told every student received at least one certificate:

\(\displaystyle 39-2(x+y+z)+x+y+z+3=34\)

\(\displaystyle x+y+z=8\)

And so:

\(\displaystyle a+b+c=39-2(8)=23\)

And so we may conclude that 3 students received 3 certificates, 8 students received 2 certificates, and 23 received 1 certificate.
 

Attachments

  • noelia.jpg
    noelia.jpg
    10.7 KB · Views: 38

1. What is a Venn diagram?

A Venn diagram is a visual representation of the relationships between different sets of data. It consists of overlapping circles or other shapes, with each circle representing a set and the overlapping area showing the similarities between the sets.

2. How do I use a Venn diagram?

To use a Venn diagram, first identify the sets or categories you want to compare. Then, draw overlapping circles or shapes to represent each set. Finally, fill in the overlapping areas to show the similarities between the sets.

3. What is the purpose of using a Venn diagram?

A Venn diagram is used to visually illustrate the relationships between different sets of data. It can help to identify similarities and differences between the sets, and can also be used to solve logical problems.

4. Can a Venn diagram be used for more than two sets?

Yes, a Venn diagram can be used for any number of sets. As long as the sets have some overlap, they can be represented in a Venn diagram.

5. Are there any limitations to using a Venn diagram?

While Venn diagrams can be a useful tool for visualizing data, they have limitations. For example, they may not accurately represent complex relationships between multiple sets, and they may not be suitable for representing large amounts of data.

Similar threads

  • General Math
Replies
1
Views
2K
  • General Math
Replies
4
Views
12K
Replies
1
Views
2K
Replies
1
Views
2K
  • Set Theory, Logic, Probability, Statistics
Replies
10
Views
2K
  • Set Theory, Logic, Probability, Statistics
Replies
1
Views
1K
  • Introductory Physics Homework Help
Replies
9
Views
1K
Replies
3
Views
2K
  • Special and General Relativity
Replies
6
Views
1K
  • Calculus and Beyond Homework Help
Replies
2
Views
4K
Back
Top