Part 2 | Draw a venn diagram and include the given information

In summary, In part I of the problem we are told 25 people have diabetes, so what would you put into the area representing those with diabetes but not on medication?When looking at the diagram given, it is clear that the total number of people with diabetes is 38. Therefore, 18 should be put into the area representing those with diabetes but not on medication.
  • #1
mathlearn
331
0
Part 1 : http://mathhelpboards.com/pre-algebra-algebra-2/draw-venn-diagram-include-given-information-19723.html#post90092

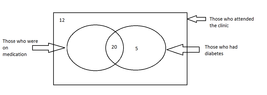
Among the 40 persons who visited the clinic , there were persons who were on medication and those who were not on medication as well. An incomplete Venn diagram drawn using this information is shown below

https://www.physicsforums.com/attachments/6060._xfImport

iii . Copy the Venn diagram given above and write down the values relevant to the two empty regions in it.

iv. How many persons had diabetes but were not on medication.
 

Attachments

  • Venn_3.png
    Venn_3.png
    6.6 KB · Views: 57
Last edited:
Mathematics news on Phys.org
  • #2
In part I of the problem we are told 25 people have diabetes, so what would you put into the area representing those with diabetes but not on medication?
 
  • #3
MarkFL said:
In part I of the problem we are told 25 people have diabetes, so what would you put into the area representing those with diabetes but not on medication?

Thank you very much MarkFL (Smile) (Party)

Those with diabetes but not on medication would be = 25-20 = 5

So the updated Venn,

View attachment 6061

Completing the Venn,

The total who were on medication 40-12=38

View attachment 6062

Answer here would be,

iv. How many persons had diabetes but were not on medication.

5

Correct? (Smile)

Many Thanks (Clapping)
 

Attachments

  • Venn_3.png
    Venn_3.png
    6.6 KB · Views: 44
  • Venn_3.png
    Venn_3.png
    6.8 KB · Views: 49
  • #4
Yes, the answer to part iv is 5, however, I am curious how you got 18 for those on medication but not suffering from diabetes? 40 people visited the clinic, yet your sum of all areas is 55...(Thinking)
 
  • #5
MarkFL said:
Yes, the answer to part iv is 5, however, I am curious how you got 18 for those on medication but not suffering from diabetes? 40 people visited the clinic, yet your sum of all areas is 55...(Thinking)

Well , It is given that 12 patients were not medication, So what I did was subtracted the total which is 40 from 12 to get the number of patients who were on medication which is 38

The total who were on medication 40-12=38

(Smile) (Clapping) I tried to complete that set which represents the people on medication which add up to 38 which already has 20 thereby I added 18 to sum it to 38. Which resulted me in

View attachment 6063
 

Attachments

  • Venn_3.png
    Venn_3.png
    6.8 KB · Views: 57
  • #6

Attachments

  • Venn_3.png
    Venn_3.png
    6.7 KB · Views: 48
  • Venn_3.png
    Venn_3.png
    6.8 KB · Views: 56
  • #7
I like the first one, because it all adds up to 40 as it should. ;)
 

1. What is a Venn diagram?

A Venn diagram is a graphical representation of the relationships between different sets of data. It consists of overlapping circles or other shapes that show the commonalities and differences between the sets.

2. How do I draw a Venn diagram?

To draw a Venn diagram, start by drawing overlapping circles or other shapes to represent the different sets of data. Then, label each circle with the name of the set it represents. Finally, fill in the overlapping areas with the information that is shared between the sets.

3. What information should be included in a Venn diagram?

A Venn diagram should include the names of the sets being compared, the elements or data points that are unique to each set, and the elements or data points that are shared between the sets.

4. What is the purpose of a Venn diagram?

Venn diagrams are used to visually represent relationships between different sets of data. They can help to identify similarities and differences between sets, illustrate complex concepts, and aid in problem-solving and decision-making processes.

5. What are some common misconceptions about Venn diagrams?

One common misconception is that all Venn diagrams must consist of two overlapping circles. In reality, Venn diagrams can have any number of overlapping shapes depending on the number of sets being compared. Another misconception is that all elements or data points must be represented within the overlapping areas. In some cases, elements may only belong to one set and will not be included in any of the overlapping areas.

Similar threads

Replies
5
Views
2K
  • General Math
Replies
2
Views
1K
Replies
3
Views
1K
Replies
1
Views
819
  • Programming and Computer Science
Replies
29
Views
3K
  • General Math
Replies
13
Views
9K
  • General Math
Replies
2
Views
4K
  • STEM Academic Advising
Replies
8
Views
4K
Replies
10
Views
9K
Back
Top