- #1
gxa
- 22
- 3
- TL;DR Summary
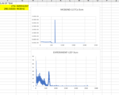
- Normalization for simulation results
Do I need to apply normalization these two graphs to make them similar to each other and if so, how can I do this? I would be very grateful if you can help me if these results are consistent. I compared the results of the experiment and the results of the mcbend simulation.