Discussion Overview
The discussion revolves around the application of Riemann sums in the context of an AP Calculus exam problem. Participants explore how to calculate the total area under a curve represented by a function R(t) over a specified interval, considering the nuances of interval lengths and heights.
Discussion Character
- Mathematical reasoning
- Homework-related
- Debate/contested
Main Points Raised
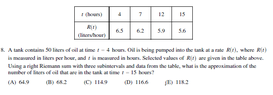
- One participant notes that the time intervals are 3 hours apart except between 7 and 12, questioning whether to interpret this differently.
- Another participant calculates an approximate total volume using Riemann sums, presenting the formula and resulting value of 114.9 L.
- A participant expresses confusion about whether the intervals must be equal, suggesting that they should follow the given data instead.
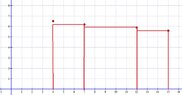
- There is a question regarding the graphical representation of the data, specifically about displaying only relevant ticks on a graph.
- Another participant clarifies that the intervals do not need to be equal and describes how to determine the bases and heights for the Riemann sum calculation.
Areas of Agreement / Disagreement
Participants express differing views on whether the intervals must be equal, with some asserting that they do not need to be, while others seem uncertain. The discussion remains unresolved regarding the interpretation of the intervals and the graphical representation.
Contextual Notes
There is ambiguity regarding the assumptions about interval equality and the specific definitions of the terms used in the discussion, such as "ticks that apply." These aspects remain unresolved.