SymNeric
- 1
- 0
- TL;DR
- I need advice on how to compare pitching moment data
Hi guys, I hope everyone is safe and well.
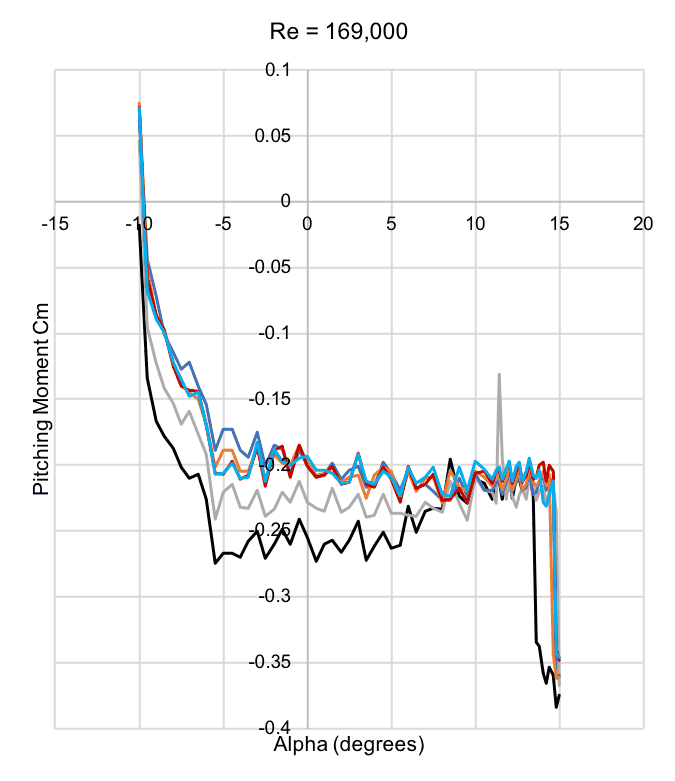
I'm currently nearing the end of my third year dissertation, and I'm looking at analysing pitching moment coefficient (CM) data over a full range of angles of attack for airfoils with different serrations on the trailing edge. What are things to look for and what would, for instance, a lower value mean? I am aware that a CM of 0 is a symmetric airfoil and that negative is a nose-down moment etc. but I am unsure how to compare the results from different trailing edges to each other? Attached is one set of data, as an example.
Any and all help/insight is appreciated.
I'm currently nearing the end of my third year dissertation, and I'm looking at analysing pitching moment coefficient (CM) data over a full range of angles of attack for airfoils with different serrations on the trailing edge. What are things to look for and what would, for instance, a lower value mean? I am aware that a CM of 0 is a symmetric airfoil and that negative is a nose-down moment etc. but I am unsure how to compare the results from different trailing edges to each other? Attached is one set of data, as an example.
Any and all help/insight is appreciated.
Last edited by a moderator:

