SUMMARY
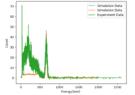
The discussion focuses on enhancing the graphical representation of simulation results obtained from the MCBEND simulation program. The user seeks assistance in adding background information to the graph derived from their laboratory experiments. The integration of experimental data with simulation outputs is emphasized as a critical step in validating the simulation results.
PREREQUISITES
- Familiarity with MCBEND simulation software
- Understanding of graphical data representation techniques
- Knowledge of experimental data analysis
- Basic skills in data visualization tools
NEXT STEPS
- Research methods for integrating experimental data with simulation results
- Explore data visualization techniques specific to MCBEND outputs
- Learn about effective graph background design for scientific presentations
- Investigate software options for enhancing graphical representations
USEFUL FOR
Researchers, simulation analysts, and laboratory technicians looking to improve the clarity and effectiveness of their simulation data presentations.