Rectifier
Gold Member
- 313
- 4
Hey there!
So I have this circuit:
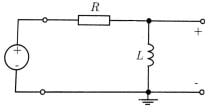
with R= 1kOhm and L=10mH
and for some reason the theoretical and real values differ drasticly for lower frequencies
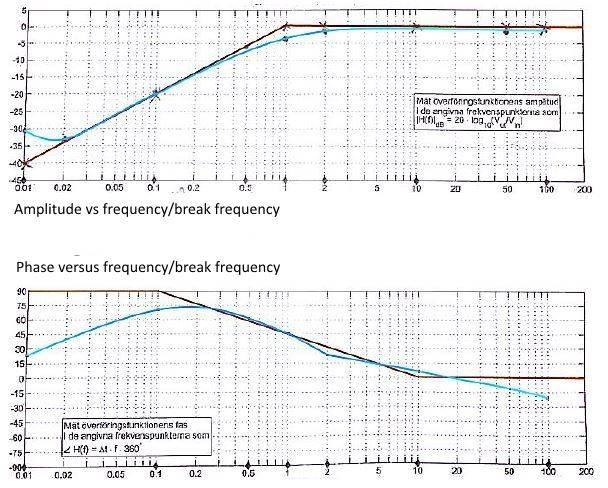
Brown lines are representing the asymptotic and approximation lines.
Blue lines are connecting my measured values.
Amplitude is the amplitude of the transfer function in dB.
What can this shift in both amplitude and phase be caused by? Is it the internal resistance of the indoctor or is it the internal capacitance of the inductor or is it something else?
So I have this circuit:
with R= 1kOhm and L=10mH
and for some reason the theoretical and real values differ drasticly for lower frequencies
Brown lines are representing the asymptotic and approximation lines.
Blue lines are connecting my measured values.
Amplitude is the amplitude of the transfer function in dB.
What can this shift in both amplitude and phase be caused by? Is it the internal resistance of the indoctor or is it the internal capacitance of the inductor or is it something else?
