Difference between two percentage uncertainty equations

  • Context: Undergrad 
  • Thread starter Thread starter homeworkhelpls
  • Start date Start date
  • Tags Tags
    Confused Uncertainty
Join the discussion
Registration is free. Ask a follow-up in this thread, or start your own.
7 replies · 2K views
homeworkhelpls
Messages
41
Reaction score
1
im confused about the difference of this equation:
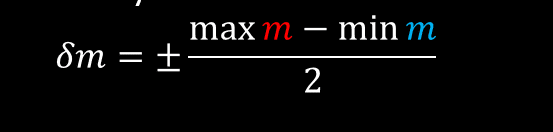
1665243195922.png

and this one:
1665243195935.png

which gives percentage uncertainty, so which one should be used to calculate the uncertainty?
 
Last edited:
Physics news on Phys.org
Are you trying to compute the average gradient?

or are you trying to find the best line through a set of data points plotted in XY form?
 
my bad I am trying to find the uncertainty from the graph
 
The two equations are out of context but my guess is that they refer to different methods of determining the slope (gradient). It looks like the second equation assumes that one knows the best line (determined how?) while the first equation assumes that one draws two eyeballed straight lines that pass reasonably well over the data such that the best line has a slope between them. Which one you use depends on your method of finding the best line.
 
Reply
  • Like
Likes   Reactions: TSny and robphy
kuruman said:
The two equations are out of context but my guess is that they refer to different methods of determining the slope (gradient). It looks like the second equation assumes that one knows the best line (determined how?) while the first equation assumes that one draws two eyeballed straight lines that pass reasonably well over the data such that the best line has a slope between them. Which one you use depends on your method of finding the best line.
no sorry bro i don't think you understand it very well i mean the uncertainty and best fit is just determined by drawing the line, thanks for the help though
 
Reply
  • Sad
Likes   Reactions: robphy
It almost certainly looks like a simplified procedure that likely overestimates the uncertainty.
 
homeworkhelpls said:
which one should be used to calculate the uncertainty?
I assume that you mean the standard uncertainty of the slope.

You have not provided enough information. What do these max and min slopes represent? Are they slopes from a 95% confidence interval around the fitted slope parameter. Are they slopes takin men directly from the data? Do you have any other estimate that could describe the statistical distribution from which these slopes are drawn?
 
Hint: Think about the units.

What units would you expect a percentage uncertainty to have versus an absolute uncertainty?
