Does Destructive Interference Affect Starlight in a Double Slit Experiment?

Join the discussion
Registration is free. Ask a follow-up in this thread, or start your own.
110 replies · 12K views · last reply
Devin-M
Messages
1,078
Reaction score
771
In this MIT course video, he shows on an optical table that in certain cases, when destructive interference occurs the light is going back to the laser (fast forward to 5:22 in the video below)


My question is when I do a double slit experiment with starlight by putting 2 slits in front of my objective lens as shown below, is the light in the areas showing destructive interference being reflected back to the star to maintain conservation of energy?
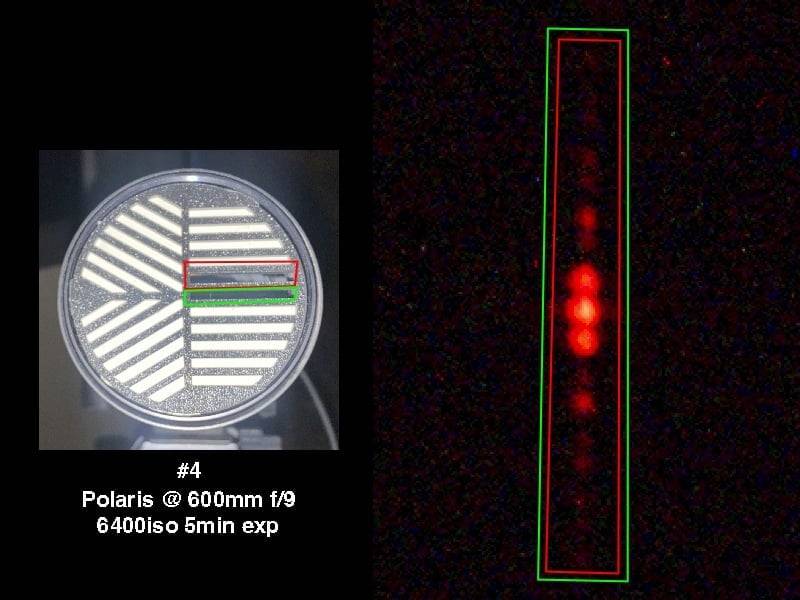
Left: photo of a circular aperture mask with white slit bars arranged in radial patterns, with red and green rectangles marking two slits; caption reads #4 Polaris @ 600mm f/9 6400iso 5min exp. Right: dark image of a vertical column of red spots inside red and green outlined strips.

*H-Alpha narrowband filter (656nm +/- 3nm was used in front of the sensor)
 
Last edited:
Physics news on Phys.org
"Where does the energy go" implies it was somewhere else and somehow moved/ That is usually not a good way to think about multiple configurations.

That said, if you want to know where does the energy go in the dark bands, where does it come from in the bright bands.
 
  • Like
Likes   Reactions: Couchyam and vanhees71
Vanadium 50 said:
That is usually not a good way to think about multiple configurations.
To expand on that, the reason it is not a good idea is that the energy may not be the same between different configurations. Conservation of energy implies that if there is no work/heat exchange with the environment then the energy of a system remains the same over time. It does not imply that different systems have the same energy.
 
  • Like
Likes   Reactions: Vanadium 50 and vanhees71
If I let more light in (2 slits instead of 1), some areas are darker than before… So my question is where does the additional energy get deposited?
Left: photo of a circular grating-like mask with white radial stripes, with a red rectangle marking one slit region, captioned #1 Polaris @ 600mm f/9 6400iso 5min exp. Right: dark field with a vertical red-outlined strip showing a bright red blurred spot with faint spots above and below.


Left: photo of a circular grating-style aperture with white slanted and horizontal bars, with red and green rectangles marking two strips across its center. Right: dark false-colour frame of a red spot pattern running down a vertical strip outlined in red and green, labelled #4, Polaris at 600mm f/9, 6400 ISO, 5 min exposure.
 
If we compare 1 and 4, below the primary (central) band in 4, there is a dark band that doesn’t appear in 1.
Three side-by-side intensity patterns of horizontal bands on black, labelled 1) single horizontal slit (single slit interference pattern), 3) horizontal slit plus diagonal slit, and 4) horizontal slit plus second horizontal slit.
 
@Devin-M, the interferometer uses a beam-splitter and mirrors. As a result, some light is reflected back towards the source.

This is a very different setup to a simple 2-slit etup which contains no beam-splitter or mirrors.

For the simple 2 (or more)-slit setup, energy is simply spatially redistributed. Energy is reduced in regions of destructive interference; this is exactly balanced by increases in energy in regions of constructive interference. No energy is reflected back to the source in the simple 2-slit setup.
 
Steve4Physics said:
For the simple 2 (or more)-slit setup, energy is simply spatially redistributed. Energy is reduced in regions of destructive interference; this is exactly balanced by increases in energy in regions of constructive interference. No energy is reflected back to the source in the simple 2-slit setup.
If that’s the case, if I add up the red values of a vertical strip from 1) and then 4) I would expect the total red values from 4) when added together should be approximately double the total red values from 1), since the aperture size was doubled between measurements.

RAW Files: https://u.pcloud.link/publink/show?code=kZcjE2VZR1eBfOCgGAYfuGOv9EMgPH3KIR07
 
Devin-M said:
If that’s the case, if I add up the red values of a vertical strip from 1) and then 4) I would expect the total red values from 4) when added together should be approximately double the total red values from 1)
What are these 'red values' of which you speak? For example, are they proportional to intensity?
 
Devin-M said:
Yes, unless a pixel is saturated (ie reaches the maximum value) the red values should be directly proportional to intensity.
That sounds interesting. Presumably the effects of other parameters (e.g. exposure times, slit areas) will be taken into account.

Of course, if you wanted to perform the experiment in a more controlled/reproducible manner, you could use your own light source, rather than Polaris!
 
Slits were the same size, exposure length the same— each exposure was 5 minutes. We just have double the area with 2 slits. So if the photons are spatially redistributed with the double slit I expect twice the total red value with the double slit.
 
If destructive interference is preventing detection of some of the photons, on the other hand, I’d expect less than twice as much total red value with the double slit.
 
On the left is a portion of the single slit interference pattern and the right is the comparable portion of the double slit interference pattern (no pixels in these comparable portions are saturated)....
Two side-by-side grayscale strips of horizontal bands of light and dark, showing an intensity pattern; left half is a single-slit pattern, right half a double-slit pattern with brighter stripes at the bottom.

Two black and white images side by side of vertical interference fringe patterns: left a single bright elongated spot column, right a column of several bright spots with dim spots between them.
 
Steve4Physics said:
For the simple 2 (or more)-slit setup, energy is simply spatially redistributed. Energy is reduced in regions of destructive interference; this is exactly balanced by increases in energy in regions of constructive interference. No energy is reflected back to the source in the simple 2-slit setup.
The results are:

Single Slit Red Value Sum: 7764
Double Slit Red Value Sum: 9548

Line graph of Red Values for Single Slit (blue) and Double Slit (green), with the vertical axis from 0 to 300 and no labelled horizontal axis values; both curves start high near 225 and fall, with the double slit curve often above the single slit curve.

Bar chart titled Red Value Sums comparing Single Slit (blue, about 7764) and Double Slit (green, about 9548) on a y-axis from 0 to 10000.


Dark grayscale image with two vertical columns of bright spots, the left column brighter and more concentrated near the middle, the right column with several blobs, and a thin red horizontal line with a rectangular box drawn above.

There is nowhere near twice as much red value when adding the second slit. So where did the missing energy go? With the double slit, there was twice as much aperture size on the same target for the same amount of time.
 
Last edited:
Now when I compare those results to the test I did previously with non-parallel slits (1 horizontal & 1 diagonal slit) and I add up the red values, I see almost no signs of destructive interference:

Red Values Sums:

Single Slit: 7764
Double Slit (Parallel): 9548 (1.22x higher than single slit)
Horizontal + Diagonal Slit: 15017 (1.93x higher than single slit)

In other words the horizontal and diagonal slit deposit significantly more energy in the fringes on the sensor than the parallel double slits.

Bar chart titled Red Value Sums comparing three slit setups: Single Slit about 7764, Double Slit about 9548, and Horizontal + Diagonal Slit about 15017, on a y-axis from 0 to 16000.

Line graph of red pixel values across a sensor for four slit configurations: single slit, double slit, horizontal slit and diagonal slit, with values from 0 to 300 on the vertical axis and the x-axis labelled Red Values.

Dark star-field photo with two bright blurred point sources, each with diagonal and vertical spikes, and a red rectangular box drawn across the upper middle.

Grayscale image made of horizontal bands of varying brightness, with a sharp vertical division between a left and right column, resembling a sensor readout of an interference pattern.


Grayscale photo of two vertical columns of bright spots on a dark background, with a red horizontal line and a thin rectangular outline drawn across the upper part of the image.

Grayscale image of horizontal bands of varying brightness, dark on the left half and mixed bright and dark stripes on the right, resembling a sensor readout of interference fringes.


Left: photo of a telescope aperture with a grid of slits, two highlighted in green and red, labelled #3 Polaris @ 600mm f/9 6400iso 5min exp. Right: dark star field showing red star images with green and red boxes around streaks.

Left: photo of a circular diffraction mask with white slit patterns, red and green rectangles marking two slit regions, captioned #4 Polaris @ 600mm f/9 6400iso 5min exp. Right: dark starfield-like image with a column of red blurred spots inside red and green outlined boxes.

Left: photo of a circular filter with white diagonal and horizontal slit patterns, a red box marks one slit. Right: dark astrophotograph with a red rectangular box around a bright red star spot and faint fringes. Caption: #1 Polaris @ 600mm f/9 6400iso 5min exp.
 
Last edited:
Vanadium 50 said:
"Where does the energy go" implies it was somewhere else and somehow moved/ That is usually not a good way to think about multiple configurations.

That said, if you want to know where does the energy go in the dark bands, where does it come from in the bright bands.

Dale said:
To expand on that, the reason it is not a good idea is that the energy may not be the same between different configurations. Conservation of energy implies that if there is no work/heat exchange with the environment then the energy of a system remains the same over time. It does not imply that different systems have the same energy.

Essentially the question boils down to why you get less energy in the fringes with the double parallel slit than the horizontal + diagonal slits. With horizontal & diagonal slits, I get twice as much energy as expected in the fringes (compared to single), but with the double parallel slits, about 39% of the expected energy is missing.

Bar chart titled Red Value Sums comparing Single Slit, Double Slit and Horizontal + Diagonal Slit; the Double Slit bar is lower than the Horizontal + Diagonal Slit bar, with a red callout reading Where does this energy go?
 
Devin-M said:
Essentially the question boils down to why you get less energy in the fringes with the double parallel slit than the horizontal + diagonal slits. With horizontal & diagonal slits, I get twice as much energy as expected in the fringes (compared to single), but with the double parallel slits, about 39% of the expected energy is missing.
Different systems have different energies. The question isn't why is there missing energy. There isn't any missing energy, there is just different energies for different systems.

The question is why do you personally expect the energy of those two different systems to be the same?
 
Last edited:
It’s unexpected as it implies if I do 5 minutes through both parallel slits at the same time then compare with 5 minutes through one parallel slit only followed by 5 minutes through the other parallel slit, I’ll get ~62% more energy on the sensor in the later case.
 
It is not unexpected. They are different setups and the energy with different setups is not expected to be the same.

If it is unexpected to you personally then you personally need to explain your expectation in detail. There is some reasoning step that you are doing wrong in your personal expectation, but if you don't describe your personal reasoning behind your expectation then we cannot help you.
 
Dale said:
you personally need to explain your expectation in detail.
This. Numbers will help.
 
I was expecting if I measure the # of photons N through each slit separately for X amount of time, and they are both the same quantity, that if I measure through both slits simultaneously for X time, that the # of measured photons would be 2N. But based on the previous unexpected results, when I do that test I now expect 1.22N, but I can’t explain the discrepency.
 
I'm sorry. I meant ratioanle for the numbers will help. Equations, assumptions, etc. that sort of thing,

I would not add photons to the mix.
 
Vanadium 50 said:
I'm sorry. I meant ratioanle for the numbers will help. Equations, assumptions, etc. that sort of thing,

I would not add photons to the mix.

Yes, sorry. What I’ve been measuring and calling “Red Values” and “Red Value Sums,” are more technically referred to as “ADUs” or analog to digital units since I am measuring them out of the raw sensor data.

@collinsmark can explain better than me but basically, since I used a H-Alpha narrowband filter in from of the sensor (656nm +/- 3nm), so the sensor is only receiving one wavelength of incident light, the ADUs can be multiplied by a constant to get the photon count.

collinsmark said:
I'll use JWST my first example, and my own camera as a second example:

JWST:

First, you can find the specs here:
https://jwst-docs.stsci.edu/jwst-ne...detector-overview/nircam-detector-performance

Note the "Gain (e-/ADU)" and the "Quantum efficiency (QE)" in Table 1.

As you can see, JWST uses two different gain settings, one for short wavelengths and another for long.

The Quantum Efficiency (QE) is naturally dependent on the wavelength.

So let's say that were presently using JWST's F405M filter, which is a long wavelength filter with a passband at 4 microns.

Going back to Table 1, we see that
Gain: 1.82 [e-/ADU]
QE: 90% [e-/photon]We can convert that to photons by dividing the two:
1.82 [e−/ADU]0.9 [e−/photon]=2.02 photons/ADU

So for when JWST is using its F405M filter, it takes on average about 2 photons to trigger an ADU increment.

My Deep Sky Camera: ZWO ASI6200MM-Pro:

You can find the specs here:
https://astronomy-imaging-camera.com/product/asi6200mm-pro-mono

Four stacked plots of read noise, full well, gain and dynamic range for ASI6200 against gain in units of 0.1 dB. Top: FW(e-) falls from about 50K to a few hundred. Second: GAIN(e-/ADU) falls from 0.8 to near 0. Third: DR(stops) falls from about 14 to 8. Bottom: read noise(e-rms) drops from 3.5 to about 1.5 near gain 100.


Line graph of QE [%] against Wavelength [nm] from 400 to 1000 nm for the ASI6200MM Pro sensor, peaking near 91% around 460 nm and falling to about 5% at 1000 nm.
So, for example, if I'm using my Hydrogen-alpha (Hα) filter, which as a wavelength of 656.3 nm, we can see that the QE is about 60%.

But if I set my camera gain to 0, corresponding to around 0.8 [e-/ADU], that gives

0.8 [e−/ADU]0.6 [e−/photon]=1.33 photons/ADU

So with this gain setting and when using the Hα filter, it takes on average about 1.33 photons to increment an ADU.

(I like to set my camera gain to something higher for better read noise, but I'll just use a gain setting of 0 here for the example.)

Had I instead set the gain setting to around 25, which corresponds to somewhere close to 0.6 [e-/ADU], that would correspond to roughly 1 photon/ADU on average.

Devin-M said:
 
Devin-M said:
Yes, sorry. What I’ve been measuring and calling “Red Values” and “Red Value Sums,” are more technically referred to as “ADUs” or analog to digital units since I am measuring them out of the raw sensor data.

@collinsmark can explain better than me but basically, since I used a H-Alpha narrowband filter in from of the sensor (656nm +/- 3nm), so the sensor is only receiving one wavelength of incident light, the ADUs can be multiplied by a constant to get the photon count.
Ok, this is a good description of what you are doing, but it tells us nothing about why you personally expect double the photons. We need you to explain your reasoning, not your setup. Your setup is great and it shows that your conclusion is wrong, but gives us no insight into the source of your confusion.

Please fill in the blank:

“I was expecting if I measure the # of photons N through each slit separately for X amount of time, and they are both the same quantity, that if I measure through both slits simultaneously for X time, that the # of measured photons would be 2N because _________”
 
Last edited:
Dale said:
Please fill in the blank:

“I was expecting if I measure the # of photons N through each slit separately for X amount of time, and they are both the same quantity, that if I measure through both slits simultaneously for X time, that the # of measured photons would be 2N because _________”

...because:

"The amount of light captured by a lens is proportional to the area of the aperture, equal to:

\mathrm {Area} =\pi \left({D \over 2}\right)^{2}=\pi \left({f \over 2N}\right)^{2}

https://en.wikipedia.org/wiki/Aperture

...and the double slit has double the aperture.

I performed a new test, this time where I measured each slit individually, and then both at the same time:

Slit 1 ADUs: 7165
Slit 2 ADUs: 7076
Double Slit ADUs: 9339

Each test was targeting the star Polaris with a 5 minute exposure, 600mm, f/9, 6400iso, with a H-Alpha narrowband filter (656nm) in front of the sensor on a Nikon D800 DSLR, and the camera was mounted on an equatorial mount to compensate for the Earth's rotation.

Long-exposure image of three vertical streaks of bright points of light on a dark background, with a red rectangle drawn around the upper part of the frame.

Grayscale image of vertical stripes of varying brightness across three horizontal bands, resembling a pixel-level or interference-like intensity pattern.


Line graph of ADUs per pixel across many sample points for Slit 1, Slit 2 and Double Slit; the Double Slit curve is mostly the highest, peaking near 240 at the start.

Bar chart of total ADUs: Slit 1 about 7165, Slit 2 about 7076, and Double Slit about 9339, with the double slit bar clearly tallest. Y-axis runs from 0 to 10000.

Photo of a telescope or lens fitted with a circular mask of parallel slit openings in a diagonal pattern, taken at night against a dark sky with distant lights.

Photo of a black telescope or lens end-on at night, its front cap covered with a grid of white diagonal and horizontal stripes as a double slit mask in bright reflection.

Photo of a lamp head with a circular perforated grille of white bars arranged in a three-part radial pattern, lit against a dark background.
 
Last edited:
Devin-M said:
I performed a new test, this time where I measured each slit individually, and then both at the same time:

Slit 1 ADUs: 7165
Slit 2 ADUs: 7076
Double Slit ADUs: 9339

And how did you perform the background correction? Did you take a picture with all slits closed as the background and then subtracted this data from your other pictures pixel by pixel or did you subtract some flat background?
 
  • Like
Likes   Reactions: Motore and vanhees71
The pictures are so grainy I have a hard time believing you can conclude anything meaningful from them.
We all know that the pattern for the single-slit and the double-slit at the same place cannot be the same, so I would expect a different light intensity there, but not necessarily double the intensity of a single-slit.
Also, why don't you take the start of the measurement from the center (as it seems to me the double-slit measurements have the center much brighter than the single-slit measurements), as that can account for the missing light.
 
Devin-M said:
"The amount of light captured by a lens is proportional to the area of the aperture
OK, so here is the error. That rule is based on the concepts of ray optics. Ray optics in turn is based on the assumption that diffraction effects are negligible. That is not the case here. So you have to calculate it using different methods. Specifically you have to account for diffraction and interference. The approximations of ray optics don’t hold, so neither do the conclusions of ray optics.
 
  • Like
  • Informative
Likes   Reactions: vanhees71 and PeroK
Cthugha said:
And how did you perform the background correction? Did you take a picture with all slits closed as the background and then subtracted this data from your other pictures pixel by pixel or did you subtract some flat background?
Devin-M said:
Slit 1 ADUs: 7165
Slit 2 ADUs: 7076
Double Slit ADUs: 9339
I've now (at your suggestion) looked at how much noise is in equal area with no signal...

Noise ADUs in area w/ no signal: 2634
Slit 1 ADUs w/ noise subtracted: 4531
Slit 2 ADUs w/ noise subtracted: 4442
Double Slit ADUs w/ noise subtracted: 6705 (1.47x higher than slit 1)

Bar chart of total ADU counts: Slit 1 and Slit 2 noise subtracted about 4500 each, double slit noise subtracted about 6700, equal area with no signal about 2600, and unsubtracted slit 1, slit 2 and double slit totals about 7100, 7000 and 9300.

Noise Sample:
Dark image with faint vertical grey and black stripes of varying brightness running top to bottom, showing no clear signal, consistent with a noise sample.
 
@Devin-M are you looking at the whole picture, or only a part? I'm not sure you can only look at the diffraction spikes and get a meaningful result. I'd suggest get a good average background for each frame and then subtracting this from every pixel in the image before summing the ADU's together. Basically, measure the total light that hit the sensor, not just a part of it. Note that this might mean that you need to take more images and be very careful not to saturate any pixel.
 
  • Like
Likes   Reactions: Motore and collinsmark