kelly0303
- 573
- 33
Thank you for the reply again! Isn't the formula for the linewidth: ##\frac{c}{FL}##, where F is the finesse and L the cavity length (about 1 meter in my case). So I would get ##\frac{3\times 10^8}{10^4} = 3\times 10^4 ## i.e. 30 kHz?Twigg said:This is very suspicious. If I were you, I would spend some time to confirm your linewidth measurement before anything else. A broader-than-expected linewidth could very likely mean that you have dirt on your cavity mirrors. Dirt scatters light from the cavity mode into random, uncoupled modes, so it behaves similarly to excess transmission loss (increases linewidth) except that the lost power doesn't actually transmit through the cavity (so your transmission contrast is lower than if you just had less reflective mirrors). Dirt also creates noise when it gets really bad (I couldn't give you a number, it's just from my experience). In my case, the cavity I work on (>200000 finesse when clean) loses about a factor of 2 in finesse for every week or so it spends out of vacuum. Because your finesse is much lower, yours should be more forgiving.
To put some rough numbers on this: If your beam is 1mm in diameter when it reflects off each mirror and you have a spec of dust that is 10 microns in radius on one your mirrors, then this spec of dust will scatter a fraction of your intracavity power equal to ##\frac{\pi \times (10\mathrm{\mu m})^2}{\pi \times (0.5\mathrm{mm})^2} = \frac{1}{2500}##. In other words, your finesse will be limited to 2500. For context, a human hair is usually 50-100 microns thick. A 10 micron radius particle ought to be clearly visible on a benchtop microscope at the high magnification settings, so you could try looking at your cavity mirrors under a microscope.
I don't have any experience working on cavities that aren't in vacuum and with similar finesse to yours, so I couldn't tell you how concerned you should be. Maybe someone else on the forums has?
Also, I'm confused by your estimated linewidth. If your cavity linewidth is 30kHz (when clean) and your finesse is 10,000, then your FSR ought to be 3GHz. If that's true, then your total cavity path length should be 10cm, but it looks waaay longer in the pictures in post #11?Do you know the modulation port's scaling factor for your diode laser? Multiply that number by 20V (output voltage range of the D2-125 lockbox) and that's your servo's locking range (but if your laser controller has a smaller input voltage range than the D2-125's +/-10V, use that voltage instead). I would look at your transmission peak while scanning and see what the typical range of frequency noise is. How does that frequency noise compare to the locking range?
Edit: If you do try to look at your mirrors under a microscope, it can be a bit tricky to focus on the surface of the mirror because there shouldn't be anything to focus on when you look at a clean mirror. I usually keep a cheap dirty mirror around of the same thickness as your cavity mirrors, and I focus the microscope on the dirt on the cheap mirror. Then I swap the dirty mirror with the optic I actually want to look at (i.e., your cavity mirror), and it should be pretty nearly focused. Alternatively, if you have a really fancy optical microscope, dark-field imaging is the way to go! It makes examining optics really, really easy!
Do you know the modulation port's scaling factor for your diode laser? Multiply that number by 20V (output voltage range of the D2-125 lockbox) and that's your servo's locking range (but if your laser controller has a smaller input voltage range than the D2-125's +/-10V, use that voltage instead). I would look at your transmission peak while scanning and see what the typical range of frequency noise is. How does that frequency noise compare to the locking range?
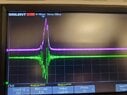
The laser changes by 100 MHz per applied V. Is that what you mean by scaling factor? My laser can only accept between -4 and 4 V as input so I am using a voltage divider (when using the Vescent servo) and I am usually only applying between -3 and 3 V, so I am covering at most 600 MHz (but usually I do much lower, just to see one peak per ramp). What exactly do you mean by frequency noise? The peak sometimes moves left and right quite a lot (more than 100 MHz), probably due to mechanical vibration (as that motion is quite slow). Do you mean some noise on top of that?
EDIT: I will have to look around for a microscope, but I did clean the mirrors in the past without a visible change in the linewidth. I also completely changed the mirrors from 0.5 to 1 inch (I thought it might be some diffraction losses issue) and I got similar results, so I doubt the linewidth issue (assuming I did the math right) is from the cleanliness of the mirrors (at least not only from that).
Last edited:

 ]).
]).