freddie_mclair
- 43
- 2
Hi everyone, recently I was working out an elasto-plastic model to make some residual stress predictions: see it here.
Recently I got some real tensile tests results from a lab, therefore I would like to extract a better stress-strain curve to plug into my elasto-plastic model using the Ramberg-Osgood equation. The problem is that I cannot get the Young's modulus that they claim to have obtained!
Here's the tensile test plot:
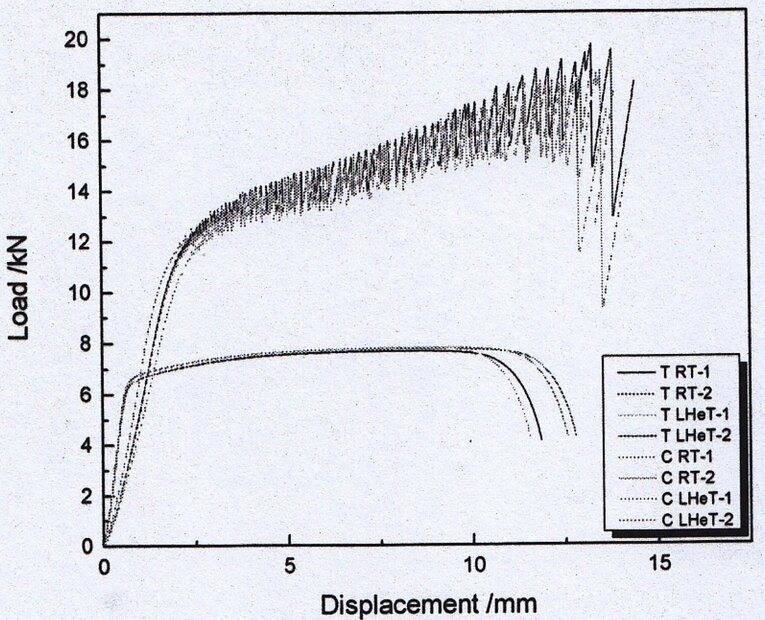
The stress-strain curve I would like to extract corresponds to the plots on the bottom part of the image (ultimate stress around 7.5kN).
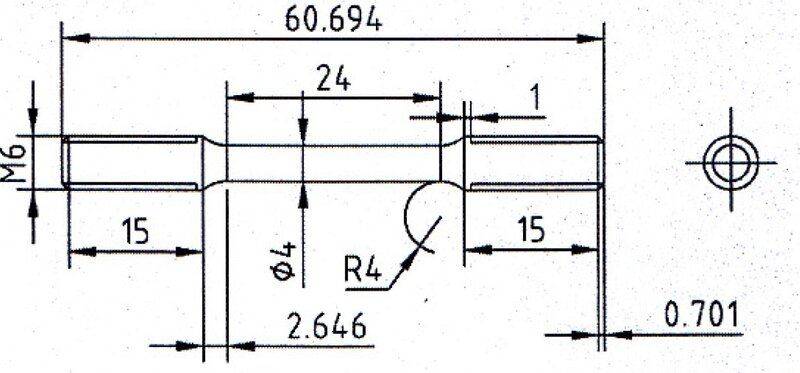
The geometry of the samples is the following:
The results reported by the lab are the following:
Thanks in advance!
Recently I got some real tensile tests results from a lab, therefore I would like to extract a better stress-strain curve to plug into my elasto-plastic model using the Ramberg-Osgood equation. The problem is that I cannot get the Young's modulus that they claim to have obtained!
Here's the tensile test plot:
The stress-strain curve I would like to extract corresponds to the plots on the bottom part of the image (ultimate stress around 7.5kN).
The geometry of the samples is the following:
The results reported by the lab are the following:
- ##\mbox{- Yield strength: } S_y=480\mbox{ MPa}##
- from the plot we get ##6{kN}/(\pi 2^2)=477.5\mbox{ MPa}##. OK here!
- ##\mbox{- Tensile ultimate strength: } S_u=615\mbox{ MPa}##
- from the plot we get around ##7.5{kN}/(\pi 2^2)=597\mbox{ MPa}##. OK here too!
- ##\mbox{- Elongation: } 54\%##
- from the plot, we see that it has been elongated up to around 12mm, which, if we consider the length of the sample to be 24mm, it corresponds to these 50%. Also fine!
- ##\mbox{- Young's modulus: } E=187\mbox{ GPa}##
- I unable to get this result... from the plot, the displacement corresponding to the Yield strength (##@6\mbox{ kN}##), ##S_y=480\mbox{ MPa}## is around 0.6mm, which then leads to a strain of ##(24.6-24)/24=0.025##. Consequentially, this gives me an order of magnitude lower for Young's modulus: ##480/0.025=19.2\cdot10^3\mbox{ MPa}##, i.e., ##19.2\mbox{ GPa}##.
Thanks in advance!