Nora
- 2
- 0
- TL;DR
- time (distance) axis of Inverse Fast Fourier Transform (IFFT) from Vector Network Analyzer (VNA) S-parameter data.
Hi
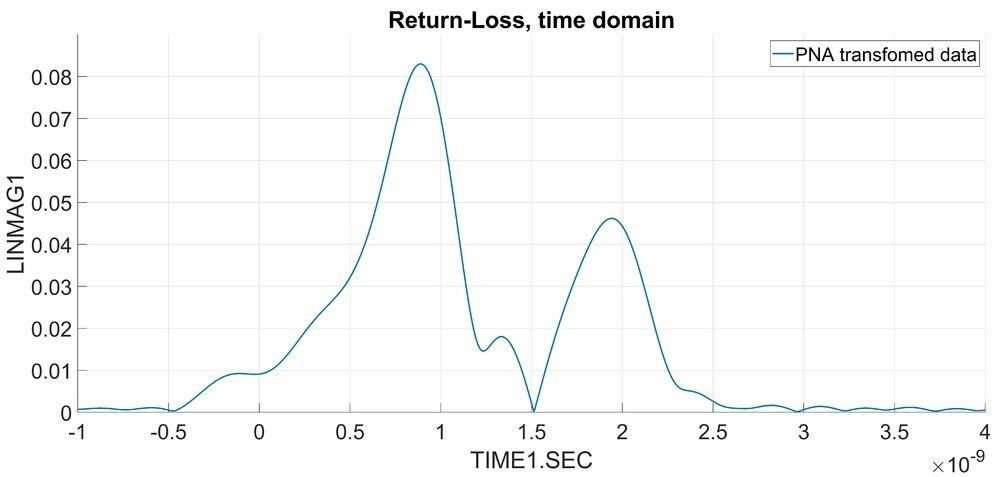
I would like to transform the S-parameter responce, collected from a Vector Network Analyzer (VNA), in time domain by using the Inverse Fast Fourier Transform (IFFT) . I use MATLAB IFFT function to do this and the response looks correct, the problem is that I do not manage to the time scaling correct. The VNA has a build in time domain toolbox so I know how it should look like, see the figure below.
In the figure below I have plotted the MATLAB transformed data with the index on x-axis (also zoomed in between N=0 to 20, N_max is 1600)
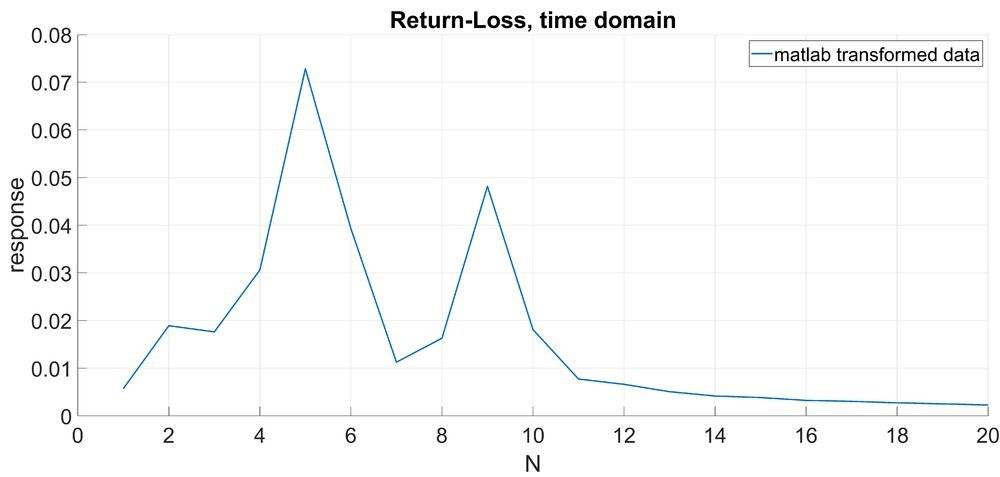
At first I assumed that the increment on x-axis would be 1/bw/N_max where bw is the band width (i.e. f_max-f_min) and N_max is the number of samples. This is obviously wrong with a factor of 1e-3.
I would much appreciate if someone would like to help to get this correct! I have attached the S-matrix data in the txt file. First column is the frequency in GHz, second is real part of the response and third is imaginary part of the response.
My thanks in advance
/Thomas
I would like to transform the S-parameter responce, collected from a Vector Network Analyzer (VNA), in time domain by using the Inverse Fast Fourier Transform (IFFT) . I use MATLAB IFFT function to do this and the response looks correct, the problem is that I do not manage to the time scaling correct. The VNA has a build in time domain toolbox so I know how it should look like, see the figure below.
In the figure below I have plotted the MATLAB transformed data with the index on x-axis (also zoomed in between N=0 to 20, N_max is 1600)
At first I assumed that the increment on x-axis would be 1/bw/N_max where bw is the band width (i.e. f_max-f_min) and N_max is the number of samples. This is obviously wrong with a factor of 1e-3.
I would much appreciate if someone would like to help to get this correct! I have attached the S-matrix data in the txt file. First column is the frequency in GHz, second is real part of the response and third is imaginary part of the response.
My thanks in advance
/Thomas
