member 731016
- Homework Statement
- Please see below
- Relevant Equations
- Please see below
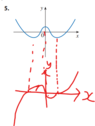
For this Problem 5,

The solution is,

However, I though the graph of f' would have end behavior more like,

Does someone please know whether I am correct?
Many thanks!
The solution is,
However, I though the graph of f' would have end behavior more like,
Does someone please know whether I am correct?
Many thanks!
Attachments
Last edited by a moderator: