Discussion Overview
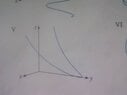
The discussion centers around the graphing of the parametric equations x=t, y=1/(1+t^2), and z=t^2, with a particular focus on whether the resulting shape is a parabola. Participants explore the implications of these equations and the visual representation in three-dimensional space.
Discussion Character
- Exploratory, Technical explanation, Conceptual clarification, Debate/contested
Main Points Raised
- One participant expresses uncertainty about the classification of the graph, noting that it resembles a parabola as depicted in their book.
- Another participant inquires about the ranges for the variables x, y, and z as defined by the parametric equations, suggesting a deeper analysis of the graph's properties.
- A participant proposes to eliminate the parameter from x and y, leading to the equation y=1/(1+x^2), and describes its characteristics, including a global maximum and horizontal asymptotes.
- There is a discussion about the concept of shadows cast by the curve onto the xy-plane, questioning whether the resulting shadow corresponds to the graph of y=1/(1+x^2).
- Several participants express confusion about the graph and its implications, indicating a need for clarification on the relationship between the parametric equations and their graphical representation.
Areas of Agreement / Disagreement
Participants do not reach a consensus on whether the graph is definitively a parabola, and multiple viewpoints regarding the interpretation of the graph and its properties remain present.
Contextual Notes
Participants have not fully explored the ranges of the variables or the implications of the z component in the context of the graph, leaving some assumptions and dependencies unresolved.