everjordan
- 7
- 0
Hi :)
I am designing 6x1 series fed microstrip rectangular patch antenna by using HFSS.
The schematic of the my design is below.
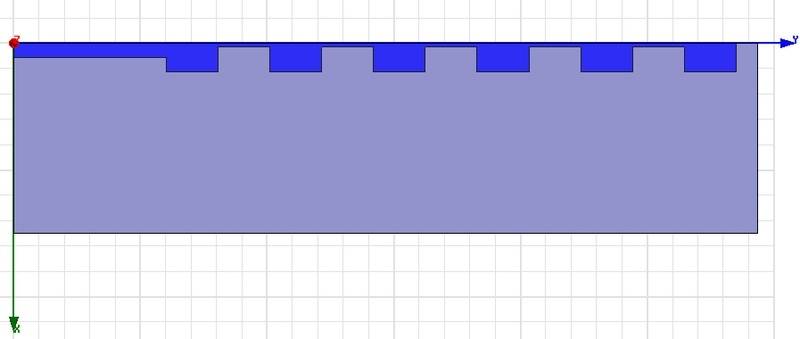
This figure is the half of my design for the past analysis.
My goal is below.
SLL(side lobe level <-25dB)
S11(<-20dB)
After I design the patch antenna, I found SLL around -20dB.
However, I want to reduce this value.
So, I check the internet & some papers and found some important parameters.
1. both width and length of patch antenna
2. length of the connection line
{
connection line is the microstrip line.
connection line exits between patch and another patch.
connection line has high impedance[100ohms].
I set the length of line L-2delta(L) {L is the length of the patch antenna}
}
And below is the parameters for antenna.
resonance freq = 26GHz
permitivity = 2.2
height of the substrate = 0.79mm
The values of effective permitivity, both length and width of the patch antenna
are below.

I found that the calculated values are not perfect value.
So I have changed the value such as width of the patch antenna, length of the connection line.
If the width of patch antenna is changed, length of the patch antenna also will be changed.
So, I use MATLAB tool then change the length of the patch antenna and effective permitivity.
These are MATLAB code.
{
% method to obtain patch's length
clc;
clear all;
h = 0.79;
w = 4.53;
er = 2.2;
ee = ((er+1)./2 ) + ((er-1)./2).*(1+12.*h./w)^(-0.5);
f = 26.*(10^(9));
c = 3.*10.^(8);
deltal = h.*0.412.*(ee+0.3).*((w./h) + 0.264)./(ee-0.258)./((w./h) + 0.8) ;
l = 0.5.*3.*(10.^(8))./f./sqrt(ee) - 2.*deltal./1000;
l = l*1000;
w
deltal
l
deltal+l
}
First I set these values to my desin.
However, value of SLL is only around -10~-15dB.
So, I changed width of patch antenna to lambda/2.
And I changed length of the connection line to L-delta(L).
As a result, value of SLL is around -20dB.

To reduce the value of SLL, I change the length of the connection line to -0.01mm incremental.
However, the variation is a little.
How do I make smaller value of SLL?
If u give some advices or some references, it will be helpful.
Thank you~!
I am designing 6x1 series fed microstrip rectangular patch antenna by using HFSS.
The schematic of the my design is below.
This figure is the half of my design for the past analysis.
My goal is below.
SLL(side lobe level <-25dB)
S11(<-20dB)
After I design the patch antenna, I found SLL around -20dB.
However, I want to reduce this value.
So, I check the internet & some papers and found some important parameters.
1. both width and length of patch antenna
2. length of the connection line
{
connection line is the microstrip line.
connection line exits between patch and another patch.
connection line has high impedance[100ohms].
I set the length of line L-2delta(L) {L is the length of the patch antenna}
}
And below is the parameters for antenna.
resonance freq = 26GHz
permitivity = 2.2
height of the substrate = 0.79mm
The values of effective permitivity, both length and width of the patch antenna
are below.
I found that the calculated values are not perfect value.
So I have changed the value such as width of the patch antenna, length of the connection line.
If the width of patch antenna is changed, length of the patch antenna also will be changed.
So, I use MATLAB tool then change the length of the patch antenna and effective permitivity.
These are MATLAB code.
{
% method to obtain patch's length
clc;
clear all;
h = 0.79;
w = 4.53;
er = 2.2;
ee = ((er+1)./2 ) + ((er-1)./2).*(1+12.*h./w)^(-0.5);
f = 26.*(10^(9));
c = 3.*10.^(8);
deltal = h.*0.412.*(ee+0.3).*((w./h) + 0.264)./(ee-0.258)./((w./h) + 0.8) ;
l = 0.5.*3.*(10.^(8))./f./sqrt(ee) - 2.*deltal./1000;
l = l*1000;
w
deltal
l
deltal+l
}
First I set these values to my desin.
However, value of SLL is only around -10~-15dB.
So, I changed width of patch antenna to lambda/2.
And I changed length of the connection line to L-delta(L).
As a result, value of SLL is around -20dB.
To reduce the value of SLL, I change the length of the connection line to -0.01mm incremental.
However, the variation is a little.
How do I make smaller value of SLL?
If u give some advices or some references, it will be helpful.
Thank you~!
Attachments

Last edited: