How to draw a Nyquist plot by hand and determine stability

  • Thread starter Bypass
  • Start date
  • Tags Tags
    hand Plot
3 replies · 5K views · last reply
Bypass
Messages
2
Reaction score
0
I am trying to understand how to draw nyquist plot.
Lets say the transfer function is
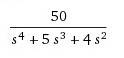
Transfer function fraction: numerator 50, denominator s^4 + 5s^3 + 4s^2.

Subbing in jω for s,

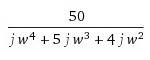
Handwritten fraction: 50 over j w^4 + 5 j w^3 + 4 j w^2, the denominator as printed in the image.
***Note: should be (jw)^4 , (jw)^3, (jw)^2

Then separating the Real and Imaginary part,
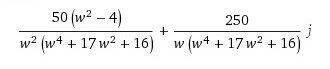
Equation of the imaginary part of a frequency response: 50(w^2 - 4) / (w^2(w^4 + 17w^2 + 16)) + 250 / (w(w^4 + 17w^2 + 16)) times j.

So when
w = 0, in the nyquist plot it is infinity
w = infinity, it is 0
Imaginary intercept is 1.25
For real intercept I am not sure. Since imaginary part is 0 only when w is infinity, i plug in infinity for w in real part. Would the real intercept be infinity or 0? It would be infinity/infinity but numerator is lower order than higher order so would it be 0 instead?

In any case, how am i supposed to plot the rough nyquist plot or at least be able to determine the stability using these 4 points?

In Matlab the Nyquist plot comes out like this
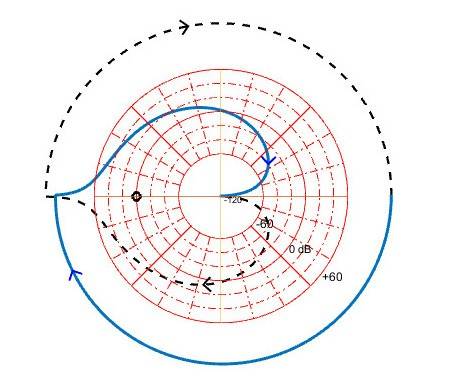
Nyquist plot on a red Nichols-style chart grid with a solid blue curve starting at the left and looping clockwise around the origin, with a dashed black mirror curve below, and a small circle marking the critical point.
 
Attachments
  • Transfer function fraction: numerator 50, denominator s^4 + 5s^3 + 4s^2.
    G1Dqr.jpg
    1.4 KB · Views: 507
Last edited:
Sorry, I cannot see what you are doing. You have:

Fraction with numerator 50 over denominator s^4 + 5 s^3 + 4 s^2, typeset as a transfer-function expression.

Substituting s with jω, you should get:

50 / ( ( jω )4 + 5( jω )3 + 4( jω )2 ) =

50 / ( ω4 - j5ω3 - 4ω2 )

Now, choose a ω and calculate the complex value of the denominator. Do the division and plot the result.

Example: ω=1 → point = ( -4.412 + j7.353 )
 
Last edited:
Hesch said:
Sorry, I cannot see what you are doing. You have:

Fraction with numerator 50 and denominator s^4 + 5 s^3 + 4 s^2, written as a transfer function.

Substituting s with jω, you should get:

50 / ( ( jω )4 + 5( jω )3 + 4( jω )2 ) =

50 / ( ω4 - j5ω3 - 4ω2 )

Now, choose a ω and calculate the complex value of the denominator. Do the division and plot the result.

Example: ω=1 → point = ( -4.412 + j7.353 )

Sorry about that, just a typo. But it is not possible to plug in every single point that encircles the RHP of S-Plane to see how many times the nyquist plot encircles -1 to determine the stability. So my question is what are some key points that I need to plot so I can determine stability of a closed loop system.
 
Try ω = 1, 2, 3, 4 . . . .

If distances are to small then continue: . . . . 8, 16, 32

If distance is to large between ω=2 and ω=3, then try ω=2.5. It's a "cut and try" process.