edguy99
Gold Member
- 449
- 28
A detailed picture of the Hydrogen red line shows a lot of detail:
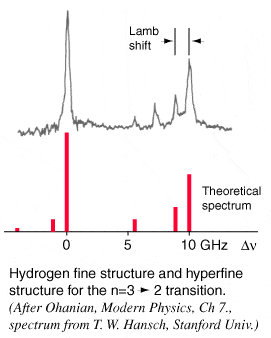
The difference in the 2 largest peaks is the fine structure, the lamb shift is clearly noted, but what are the other 2 bumps just below the lamb shift in the upper chart. I was thinking hyperfine, but I don't think that works as their values appear in red on the lower chart and don't match with the upper chart. Anyone have thoughts or know offhand?
The difference in the 2 largest peaks is the fine structure, the lamb shift is clearly noted, but what are the other 2 bumps just below the lamb shift in the upper chart. I was thinking hyperfine, but I don't think that works as their values appear in red on the lower chart and don't match with the upper chart. Anyone have thoughts or know offhand?