jose1
- 2
- 0
Hello
I have tried to resolve an exercise which is asking how the graph is modified according to the variables into the function. I would appreciate any help since accordin to my udnerstanding the function should increase
Please, follow below:
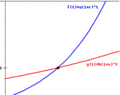
Suppose y0 is the y-coordinate of the point of intersection of the graphs below. Complete the statement below in order to correctly describe what happens to y0 if the value of a (in the blue graph of $$f(t)=a(1+r)t$$ below) is increased, and all other quantities remain the same.
If the value of a change, the function should be increased, but the answer is not. I would like to understand why?
View attachment 8577Regards,
Jose
I have tried to resolve an exercise which is asking how the graph is modified according to the variables into the function. I would appreciate any help since accordin to my udnerstanding the function should increase
Please, follow below:
Suppose y0 is the y-coordinate of the point of intersection of the graphs below. Complete the statement below in order to correctly describe what happens to y0 if the value of a (in the blue graph of $$f(t)=a(1+r)t$$ below) is increased, and all other quantities remain the same.
If the value of a change, the function should be increased, but the answer is not. I would like to understand why?
View attachment 8577Regards,
Jose
Attachments