Loglog Graph: Relation between N and E

  • Context:
  • Thread starter Thread starter evinda
  • Start date Start date
  • Tags Tags
    Graph Relation
Join the discussion
Ask a follow-up here, or get your own question answered by working scientists, mathematicians and engineers — people, not an autocomplete.
Real named experts · corrections over time · the nuance an AI answer skips
7 replies · 3K views
evinda
Gold Member
MHB
Messages
3,741
Reaction score
0
Hello! (Wave)

What does a loglog-graph represent?

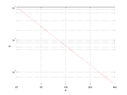
For example if we have the following loglog-graph, which is the relation between $N$ and $E$ ?

View attachment 4871
 

Attachments

  • DK6D6.png
    DK6D6.png
    4.5 KB · Views: 119
Physics news on Phys.org
Straight lines on a log-log plot correspond to power relationships of the form $y=a x^b$. The log-log plot can help you determine $a$ and $b$. See the link for info on how to do that.
 
Ackbach said:
Straight lines on a log-log plot correspond to power relationships of the form $y=a x^b$. The log-log plot can help you determine $a$ and $b$. See the link for info on how to do that.

So the loglog-graph of $E$ in respect to $N$ represents the graph of $\log (E)$ in respect to $\log (N)$, right?

Since the graphical representation of the function $\log{E (\log N)}$ is a straight line we conclude that the function is linear, so $\log E= a \log N+c \Rightarrow E=10^c N^a$.

Is it right so far?

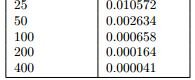
The following table shows N and E(N).
View attachment 4872How can we use it to find $c$ and $a$ ? (Thinking)
 

Attachments

  • gri.JPG
    gri.JPG
    3.6 KB · Views: 114
evinda said:
So the loglog-graph of $E$ in respect to $N$ represents the graph of $\log (E)$ in respect to $\log (N)$, right?

Since the graphical representation of the function $\log{E (\log N)}$ is a straight line we conclude that the function is linear, so $\log E= a \log N+c \Rightarrow E=10^c N^a$.

Is it right so far?

Yep!

The following table shows N and E(N). How can we use it to find $c$ and $a$ ? (Thinking)

That depends on whether the data you have is exactly on the graph, or only approximately on the graph. If exact, then just pick two points, get yourself a system of two equations in two unknowns, and solve. If inexact, then first you should fit a straight line to the data (typically least-squares fit), then just transform that line the way you just have, and you're done.
 
Ackbach said:
That depends on whether the data you have is exactly on the graph, or only approximately on the graph. If exact, then just pick two points, get yourself a system of two equations in two unknowns, and solve.

I took the last two data for $N$ and $E(N)$ and so I got the equations:

$$\log ( 164 \cdot 10^{-6})=a \log{(2 \cdot 10^2)}+c \\ \log{(41 \cdot 10^{-6})}= a \log{(4 \cdot 10^2)}+c$$

from which I got $a=-2, c=\log (656)-2$.

But according to log'('0.000164')''='a'*'log'('200')''+'c, log'('0.000041')''='a'*'log'('400')''+'c - Wolfram|Alpha the result is wrong.

So do you think that I might have a mistake at my calculations? Because I can't find one.. (Sweating)
 
evinda said:
I took the last two data for $N$ and $E(N)$ and so I got the equations:

$$\log ( 164 \cdot 10^{-6})=a \log{(2 \cdot 10^2)}+c \\ \log{(41 \cdot 10^{-6})}= a \log{(4 \cdot 10^2)}+c$$

from which I got $a=-2, c=\log (656)-2$.

But according to log'('0.000164')''='a'*'log'('200')''+'c, log'('0.000041')''='a'*'log'('400')''+'c - Wolfram|Alpha the result is wrong.

So do you think that I might have a mistake at my calculations? Because I can't find one.. (Sweating)

I'm confused. $\log(656)-2\approx 0.8169$, which is what W|A got.
 
Ackbach said:
I'm confused. $\log(656)-2\approx 0.8169$, which is what W|A got.

So is my result right although at [m] Wolfram [/m] it is $a \approx -2 $ while I got $a=-2$ ? (Thinking)
 
If W|A says it's approximately 2, I wouldn't worry about it. At that point, you probably don't have that many significant figures anyway, so worrying about that level of accuracy is counter-productive.