deki
- 15
- 1
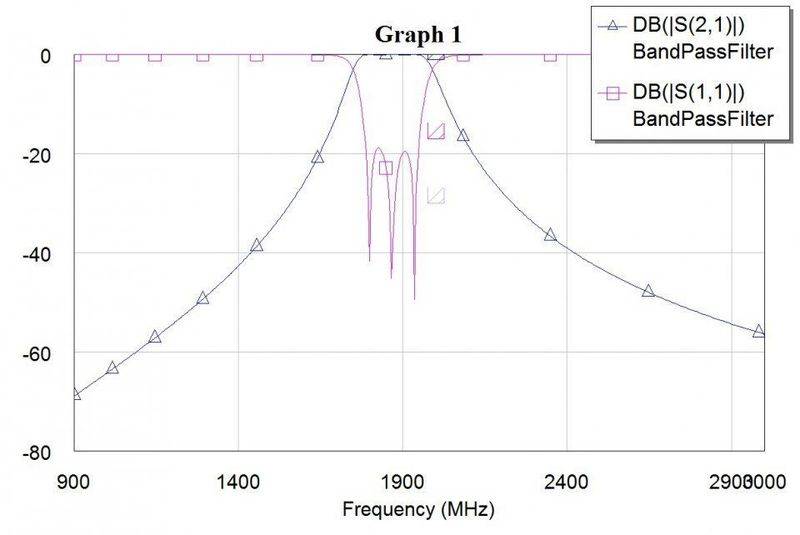
I've designed a 3rd order BPF. I tuned it in AWR Design Environment (Microwave Office), and got the response I wanted:
However using the same component values with LT Spice gives me a different response:
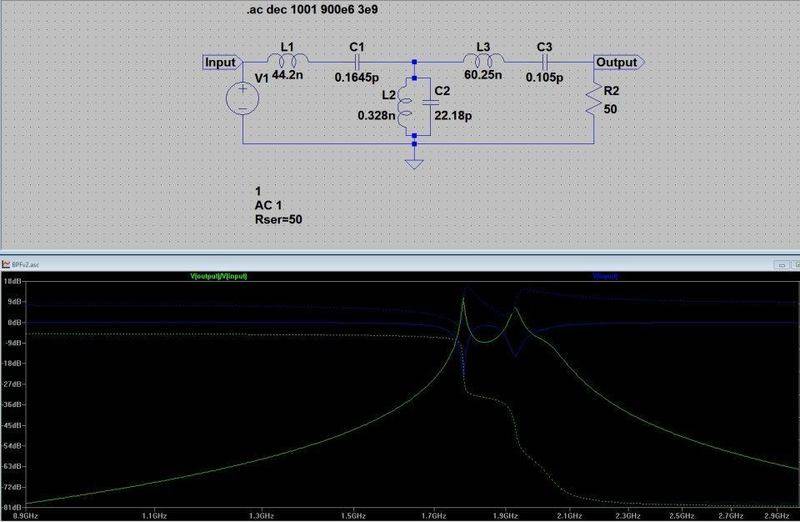
The other thing I've noted in the plot is the input voltage. I'm not that familiar with AC analysis in LT Spice, but why does the input voltage look like that? That's what is contributing to my uneven response.
However using the same component values with LT Spice gives me a different response:
The other thing I've noted in the plot is the input voltage. I'm not that familiar with AC analysis in LT Spice, but why does the input voltage look like that? That's what is contributing to my uneven response.