etotheipi
I've seen this figure kicking around, and just wanted to check that I'm not going mad. ##r_{0}## is supposed to be the Bohr radius of the first electron.
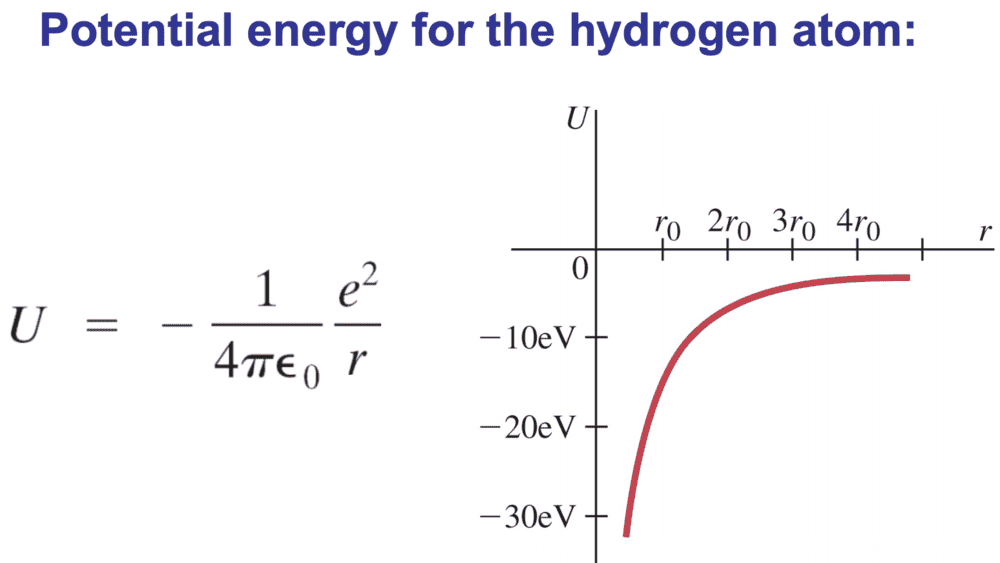
I don't think this is quite right, since at ##r_{0}## the potential energy is about ##-27eV## or something, so I think they've actually drawn the curve of ##E##. I would instead draw something like this (where T has been added for clarity):
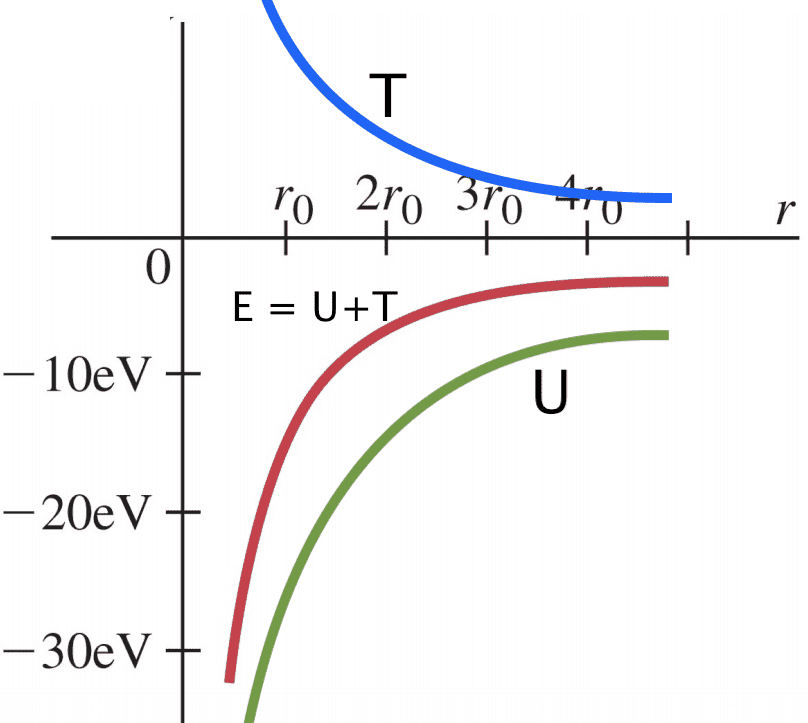
with the original red line ##E=\frac{U}{2} = -T##. Is this a justified correction? I'm just asking because there are a lot of images on google which seem to conflate ##E## and ##U## on diagrams, and it's causing me to doubt myself a little... thank you!
Also, as a sort of follow up question, some authors when considering e.g. a particle in a box choose to draw the wavefunction at the level of the energy level. Is this a purely pedagogical choice, since evidently all of the information pertaining to the energy is already encoded in the wavelength?
I don't think this is quite right, since at ##r_{0}## the potential energy is about ##-27eV## or something, so I think they've actually drawn the curve of ##E##. I would instead draw something like this (where T has been added for clarity):
with the original red line ##E=\frac{U}{2} = -T##. Is this a justified correction? I'm just asking because there are a lot of images on google which seem to conflate ##E## and ##U## on diagrams, and it's causing me to doubt myself a little... thank you!
Also, as a sort of follow up question, some authors when considering e.g. a particle in a box choose to draw the wavefunction at the level of the energy level. Is this a purely pedagogical choice, since evidently all of the information pertaining to the energy is already encoded in the wavelength?
Last edited by a moderator: