Region of continuity - Geogebra

  • MHB
  • Thread starter mathmari
  • Start date
  • Tags
    Continuity
In summary, the conversation discusses how to describe and draw with Geogebra, the region where two given functions are continuous. The experts provide a detailed analysis of the functions, including identifying the domain and range, finding points of discontinuity and singular points, identifying extrema and inflection points, and finding asymptotes. They also clarify the difference between the region where a function is continuous and its domain, and provide an example to illustrate this concept. Finally, they discuss and verify the appropriate way to draw the region using Geogebra.
  • #1
mathmari
Gold Member
MHB
5,049
7
Hey! :eek:

I am looking the following:

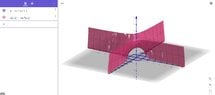
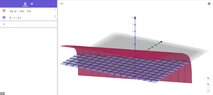
Describe and draw with Geogebra the region where the following functions are continuous:
  1. $f(x,y)=\ln (x-3y)$
  2. $f(x,y)=\cos^{-1}(xy)$

Do we have to find the region manually or is it possible to find it also using Geogebra? (Wondering)
 
Physics news on Phys.org
  • #2
Hey mathmari!

'Describe' seems to imply that we should do some analysis.
Drawing a region with Geogebra should then show what we found and/or give us some clues to what we should perhaps have described. And we might include additional objects in Geogebra to show what we found in an analysis. (Thinking)

Usual items for analysis are:
  • Identify domain.
  • Identify range.
  • Find points of discontinuity and/or singular points.
  • EDIT (added): Find zeroes, or more generally intersections with the coordinate planes and/or axes.
  • Find extrema.
  • Find inflection points and identify where the the function is convex, concave, or has saddle points.
  • Find asymptotes.
(Thinking)
 
  • #3
Klaas van Aarsen said:
'Describe' seems to imply that we should do some analysis.
Drawing a region with Geogebra should then show what we found and/or give us some clues to what we should perhaps have described. And we might include additional objects in Geogebra to show what we found in an analysis. (Thinking)

Ahh ok! Let's consider the first function $f(x,y)=\ln (x-3y)$.

Klaas van Aarsen said:
Identify domain.

It must hold $x-3y>0 \Rightarrow x>3y$. Therefore the domain is $\{(x,y)\in \mathbb{R}^2\mid x>3y\}$.
Klaas van Aarsen said:
Identify range.

The range f a logarithmic function is $\mathbb{R}$, therefore the range of $f$ is $\mathbb{R}$.
Klaas van Aarsen said:
Find points of discontinuity and/or singular points.

Aren't these the points that don't belong to the domain? (Wondering)
Klaas van Aarsen said:
Find extrema.

We have that $\nabla f=(0,0)\Rightarrow \left (\frac{1}{x-3y}, -\frac{3}{x-3y}\right )=(0,0)$. Since this cannot hold, there are no extrema.
Klaas van Aarsen said:
Find inflection points and identify where the the function is convex, concave, or has saddle points.

The Hessian matrix is $\begin{pmatrix}-\frac{1}{(x-3y)^2} & \frac{3}{(x-3y)^2} \\ \frac{3}{(x-3y)^2} & -\frac{9}{(x-3y)^2}\end{pmatrix}$. The eigenvalues are $-\frac{10}{(x-3y)^2}$ and $0$. These are non-positive, and so the matrix is negative semi-definite and so the function is concave. Is that correct? (Wondering)
Klaas van Aarsen said:
Find asymptotes.

For that we have to calculate the limits as $x\rightarrow \infty$, $y\rightarrow \infty$, $x\rightarrow 3y$, or not? (Wondering)
 
  • #4
Why isn't the region where a function is continuous not equal to the domain of the function? (Wondering)

Why isn't t as follows? Let's consider the function $f(x,y)=\ln (x-3y)$. So that it is defined it must hold that $x-3y>0\Rightarrow x>3y$. Therefore the domain is $\{(x,y)\in \mathbb{R}^2\mid x>3y\}$.

Since the function $\ln$ and the map $(x,y)\mapsto x-3y$ are continuous, the function $f(x,y)$ is also continuous. Therefore the region where the function is continuous is $\{(x,y)\in \mathbb{R}^2\mid x>3y\}$.
Let's consider the function $f(x,y)=\cos^{-1} (xy)$. The range of $\cos$ is $[-1,1]$ and so the domain of $\cos^{-1}$ is $[-1,1]$. Therefore the domain of $\cos^{-1} (xy)$ is $\{(x,y)\in\mathbb R^2\mid xy\in[-1,1]\}$.

Since the function $\cos^{-1}$ and the map $(x,y)\mapsto xy$ are continuous, the function $f(x,y)$ is also continuous. Therefore the region where the function is continuous is $\{(x,y)\in\mathbb R^2\mid xy\in[-1,1]\}$. (Wondering) Is that is correct, what do we have to draw in Geogebra? (Wondering)

I did the following:

View attachment 9605View attachment 9606 Is this what we have to draw? Or is it meant to darw something/somehow else? (Wondering)
 

Attachments

  • arccos.JPG
    arccos.JPG
    53.9 KB · Views: 63
  • ln.JPG
    ln.JPG
    72.5 KB · Views: 62
Last edited by a moderator:
  • #5
mathmari said:
Aren't these the points that don't belong to the domain?

Points of discontinuity are usually defined as points in the domain, such that a limit to them either does not exist, or is different from it.
In most cases we can tell because the derivative does not exist in that point then. (Thinking)

A point of singularity is if all partial derivatives of a parametrization are zero.
In our case of $(x,y)\mapsto (x,y,f(x,y))$ that is not possible because the partial derivative with respect to $x$ is $1\ne 0$. (Nerd)

mathmari said:
We have that $\nabla f=(0,0)\Rightarrow \left (\frac{1}{x-3y}, -\frac{3}{x-3y}\right )=(0,0)$. Since this cannot hold, there are no extrema.

The Hessian matrix is $\begin{pmatrix}-\frac{1}{(x-3y)^2} & \frac{3}{(x-3y)^2} \\ \frac{3}{(x-3y)^2} & -\frac{9}{(x-3y)^2}\end{pmatrix}$. The eigenvalues are $-\frac{10}{(x-3y)^2}$ and $0$. These are non-positive, and so the matrix is negative semi-definite and so the function is concave. Is that correct?

For that we have to calculate the limits as $x\rightarrow \infty$, $y\rightarrow \infty$, $x\rightarrow 3y$, or not?

All correct.

To be fair, finding asymptotes on a surface is a bit out of the way.Actually, I forgot one: find zeroes, or more generally the intersections with each of the coordinate planes and/or axes. (Thinking)
mathmari said:
Why isn't the region where a function is continuous not equal to the domain of the function?

Consider $h(x,y)=\operatorname{Step}(x+y)$. The function is discontinuous at all points where $x+y=0$. Those points are in the domain though. (Thinking)

mathmari said:
Why isn't t as follows? Let's consider the function $f(x,y)=\ln (x-3y)$. So that it is defined it must hold that $x-3y>0\Rightarrow x>3y$. Therefore the domain is $\{(x,y)\in \mathbb{R}^2\mid x>3y\}$.

Since the function $\ln$ and the map $(x,y)\mapsto x-3y$ are continuous, the function $f(x,y)$ is also continuous. Therefore the region where the function is continuous is $\{(x,y)\in \mathbb{R}^2\mid x>3y\}$.
Let's consider the function $f(x,y)=\cos^{-1} (xy)$. The range of $\cos$ is $[-1,1]$ and so the domain of $\cos^{-1}$ is $[-1,1]$. Therefore the domain of $\cos^{-1} (xy)$ is $\{(x,y)\in\mathbb R^2\mid xy\in[-1,1]\}$.

Since the function $\cos^{-1}$ and the map $(x,y)\mapsto xy$ are continuous, the function $f(x,y)$ is also continuous. Therefore the region where the function is continuous is $\{(x,y)\in\mathbb R^2\mid xy\in[-1,1]\}$.

That is correct. So these functions do not have discontinuities in their domain, and so there is nothing special to draw or to see for discontinuities.

mathmari said:
Is that is correct, what do we have to draw in Geogebra?

I did the following:

Is this what we have to draw? Or is it meant to draw something/somehow else?

Seems fine to me.
The function has been drawn where it is continuous. Geogebra actually already does that for us.
Additionally you have drawn the domain where the function is continuous, which highlights that. (Nod)
 

1. What is a region of continuity in Geogebra?

A region of continuity in Geogebra refers to a connected set of points on a graph where the function is continuous. This means that there are no abrupt changes or breaks in the graph, and the function is defined and smooth throughout the entire region.

2. How do you identify a region of continuity in Geogebra?

To identify a region of continuity in Geogebra, you can use the continuity tool. This tool allows you to select a set of points on the graph and determine if the function is continuous at those points. If the function is continuous, the selected points will be highlighted in green, indicating a region of continuity.

3. Why is understanding regions of continuity important in Geogebra?

Understanding regions of continuity in Geogebra is important because it helps you to identify where a function is continuous and where it is not. This can be useful in analyzing graphs and understanding the behavior of a function. It also allows you to accurately plot a function and its behavior in different regions.

4. Can a function have multiple regions of continuity?

Yes, a function can have multiple regions of continuity. This means that there can be multiple connected sets of points on a graph where the function is continuous. These regions may be separated by points where the function is not continuous, known as points of discontinuity.

5. How can regions of continuity be used in real-life applications?

Regions of continuity are used in many real-life applications, such as in engineering, physics, and economics. For example, in engineering, understanding regions of continuity can help in designing and analyzing structures or systems. In economics, it can be used to model and predict the behavior of markets and economic systems.

Similar threads

  • MATLAB, Maple, Mathematica, LaTeX
Replies
10
Views
2K
  • MATLAB, Maple, Mathematica, LaTeX
Replies
6
Views
1K
Replies
4
Views
743
  • MATLAB, Maple, Mathematica, LaTeX
Replies
3
Views
1K
  • Calculus and Beyond Homework Help
Replies
27
Views
726
  • MATLAB, Maple, Mathematica, LaTeX
Replies
8
Views
2K
  • Set Theory, Logic, Probability, Statistics
Replies
5
Views
226
  • Special and General Relativity
2
Replies
40
Views
2K
  • Calculus and Beyond Homework Help
Replies
5
Views
1K
Back
Top