cosy
- 2
- 0
I wanted to calculate the best angle for a sail on a reach, but realized I had to make the calculation a bit unrealistic by using a flat sail and doing other simplifications to make it possible for me to solve. However it seems that wasn't enough ([emoji4]) since I ended up with a quite useless answer, so I was hoping that I could get some help on here! Here is my approach (not that I assumed all sideways force was counteracted by a centerboard):
I started by assuming we had a sail that was 1m*1m and the pressure from the wind was 1N/m^2 (I just needed a constant). I then defined the area catching wind as cos(x)* the area of the sail, so the area will be cos(x)m^2.
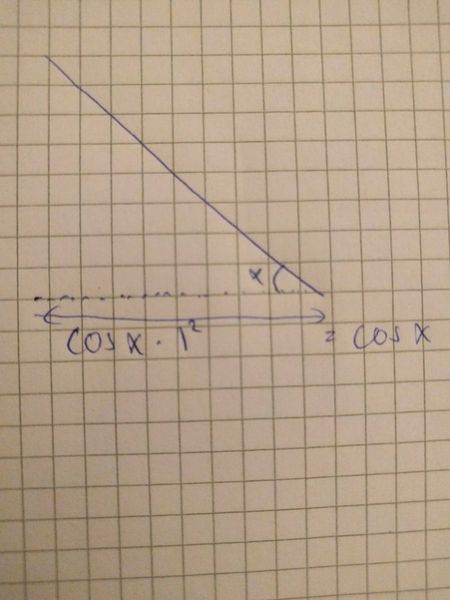
That also means that the total force on the sail will be cos(x)N.
This vector can be divided into the drag (which I will ignore for this calculation) and the lift which will be cos(x)^2.
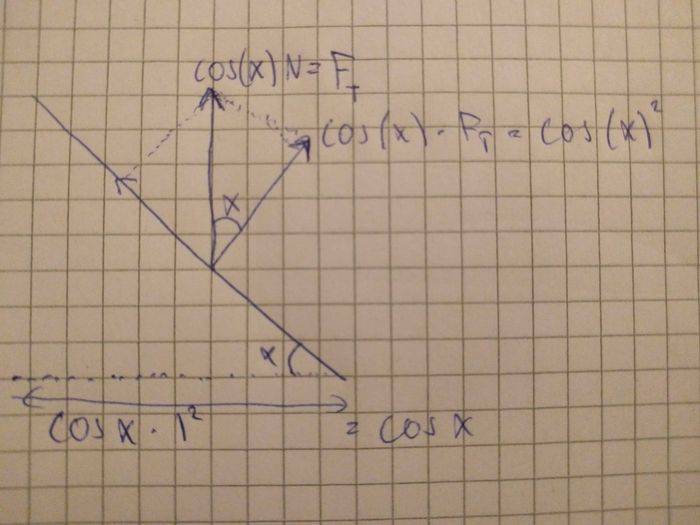
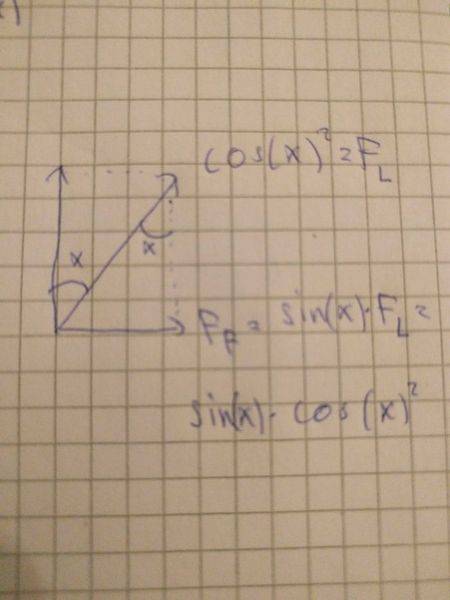
The lift itself can be divided into sideways force and force forward. The force forward will be sin(x)*cos(x)^2.
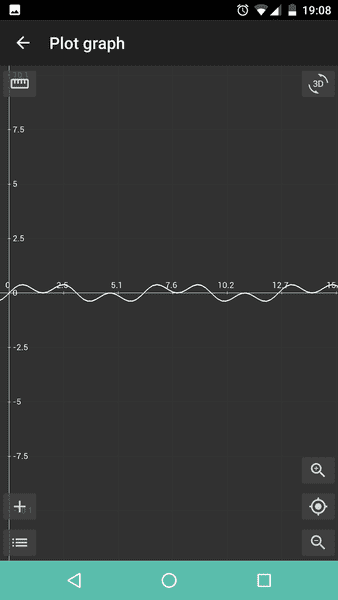
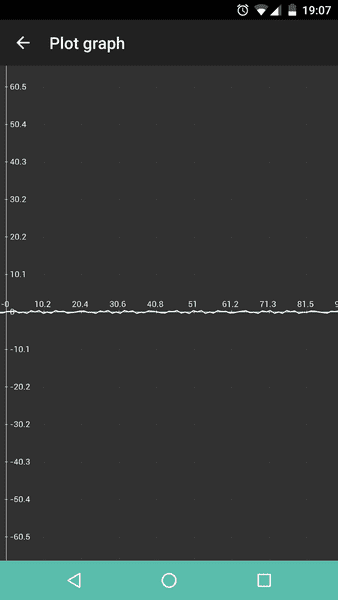
This result however does not make for a satisfying answer as the graph for the function is repetitive and looks like this:
I was expecting to get a curve looking something like this:
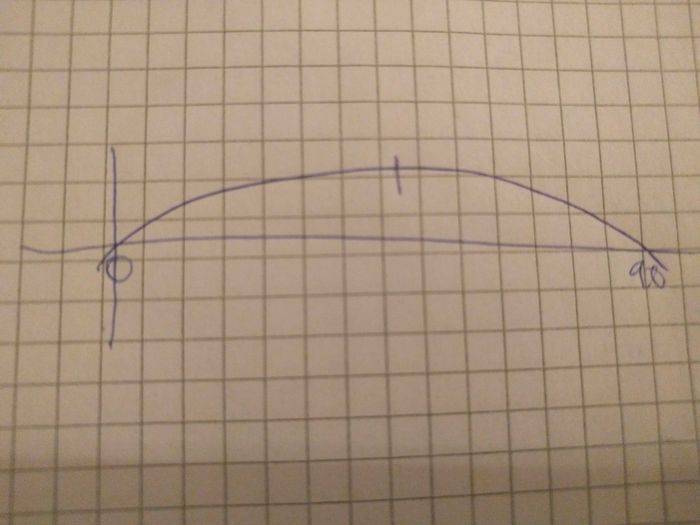
where I could find the point where the derivative was 0 to get the maximum value.
So my question is, of course: What did I do wrong? Thanks for any help in advance!
I started by assuming we had a sail that was 1m*1m and the pressure from the wind was 1N/m^2 (I just needed a constant). I then defined the area catching wind as cos(x)* the area of the sail, so the area will be cos(x)m^2.
That also means that the total force on the sail will be cos(x)N.
This vector can be divided into the drag (which I will ignore for this calculation) and the lift which will be cos(x)^2.
The lift itself can be divided into sideways force and force forward. The force forward will be sin(x)*cos(x)^2.
This result however does not make for a satisfying answer as the graph for the function is repetitive and looks like this:
I was expecting to get a curve looking something like this:
where I could find the point where the derivative was 0 to get the maximum value.
So my question is, of course: What did I do wrong? Thanks for any help in advance!