shamieh
- 538
- 0
I don't understand why I am screwing this up so bad.
Sketch the graph of the equation $$r = 2 + 4cos(\theta)$$ in polar coordinates.
So I did:
$$0 = 2 + 4cos(\theta) $$
$$= -\frac{1}{2} = cos(\theta)$$
Then got $$cos(\theta)$$ is $$-\frac{1}{2}$$ @ $$\frac{2\pi}{3}$$ and @$$ \frac{4\pi}{3} $$
Then i plotted points to get
0 ,6
pi/2 , 2
pi, -2
3pi/2 , 2
2pi, 6
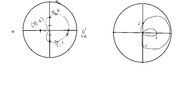
And I'm not understanding where they are getting the 2 for the like inner loop part of the centroid... My graph is on the left... The one on the right is what its supposed to look like.
View attachment 2134
I'm getting everything the same except I'm not getting the inner loop
Sketch the graph of the equation $$r = 2 + 4cos(\theta)$$ in polar coordinates.
So I did:
$$0 = 2 + 4cos(\theta) $$
$$= -\frac{1}{2} = cos(\theta)$$
Then got $$cos(\theta)$$ is $$-\frac{1}{2}$$ @ $$\frac{2\pi}{3}$$ and @$$ \frac{4\pi}{3} $$
Then i plotted points to get
0 ,6
pi/2 , 2
pi, -2
3pi/2 , 2
2pi, 6
And I'm not understanding where they are getting the 2 for the like inner loop part of the centroid... My graph is on the left... The one on the right is what its supposed to look like.
View attachment 2134
I'm getting everything the same except I'm not getting the inner loop
Attachments
Last edited: