SUMMARY
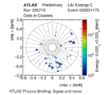
The discussion centers on the use of trigonometric axes in the plotting of electron clusters resulting from proton-proton collisions at CERN's ATLAS experiment. Specifically, the axes are defined as cos(phi) * tan(theta) for the x-axis and sin(phi) * tan(theta) for the y-axis. This approach allows for consistent angle comparisons across experiments, addressing the challenges posed by the calorimeter's non-zero depth, which could otherwise distort cluster representation. The chosen method effectively minimizes the smearing of clusters that diverge from the interaction point.
PREREQUISITES
- Understanding of trigonometric functions, specifically sine and cosine.
- Familiarity with particle physics concepts, particularly electron reconstruction.
- Knowledge of the ATLAS experiment and its data collection methods.
- Basic comprehension of the implications of calorimeter depth in particle detection.
NEXT STEPS
- Research the mathematical foundations of trigonometric transformations in physics.
- Explore the principles of electron reconstruction techniques in high-energy physics.
- Study the design and function of the ATLAS calorimeter at CERN.
- Investigate methods for visualizing particle collision data effectively.
USEFUL FOR
Particle physicists, data analysts in high-energy physics, and researchers involved in the ATLAS experiment will benefit from this discussion, particularly those focused on electron cluster analysis and data visualization techniques.