gaus12777
- 12
- 1
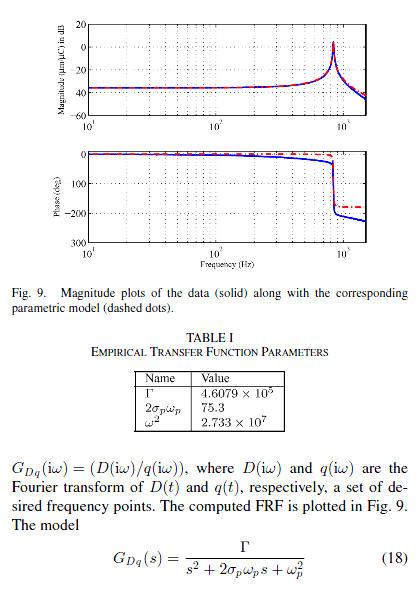
I have drawn a bode plot(freauency response), but it is not the same with one which is attatched in paper.
Using this data, I have drawn the graph using matlab.
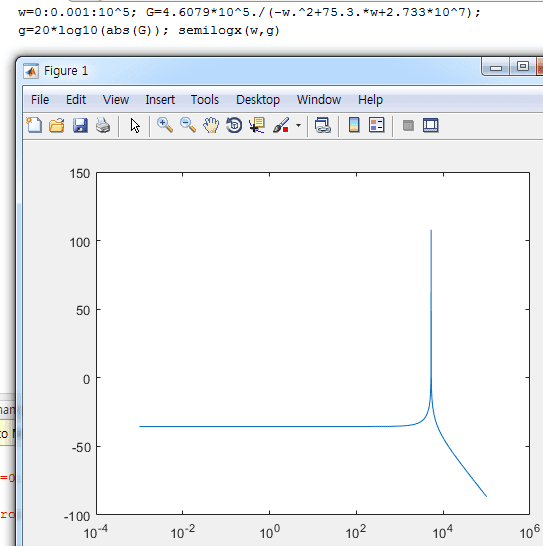
I just put data into second order vibratoion system which is given in the paper(eq 18)
Peak location of graph in paper is just in front of 10^3 but the other is just in front of 10^4.
What is wrong?
Using this data, I have drawn the graph using matlab.
I just put data into second order vibratoion system which is given in the paper(eq 18)
Peak location of graph in paper is just in front of 10^3 but the other is just in front of 10^4.
What is wrong?