Why Graphing Tools doesn't represent hole in a graph

Join the discussion
Ask a follow-up here, or get your own question answered by working scientists, mathematicians and engineers — people, not an autocomplete.
Real named experts · corrections over time · the nuance an AI answer skips
5 replies · 3K views
22990atinesh
Messages
143
Reaction score
1
Why Graphing Tools doesn't represent hole in a graph of a function. A Hole at a point in a graph is point where function is not defined.Suppose there is a function

##\frac{x}{\root{x-1}-1}##

Its should be like this
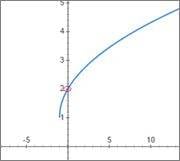
Capture.jpg


But online tools and even my android graphing tool app shows graph like this
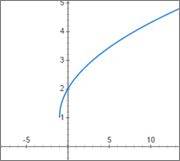
Capture_2.jpg


What I'm saying is that, apart from circle there must be some sort of marks representing that the function is not defined here.
 
Physics news on Phys.org
What's your function? Plotting ## \frac{x}{\sqrt{x-1}-1} ## gives me a different graph.

Anyhow, point discontinuities aren't always shown on generated graphics, but you can force the tool to do it.

For example, take the function ## \frac{x^2-5x+6}{x-2} ## which has a point discontinuity at ##x=2##.

Using WolframAlpha:

>> plot (x^2-5x+6)/(x-2)gives this:
MSP10311g15fe9bg4f36dc700000f418id2faei64h0.gif


>>plot discontinuities of (x^2-5x+6)/(x-2) gives this:
MSP42992072699fi0ig0dci000031436gf7gf8gd36b.gif


Now, as for why these graphic tools don't show where point-discontinuities are? I don't know, I guess you have to ask for it, because we usually don't need to see it shown that big. Theoretically, the exact point ##x=2## in our example is so small if it were to be shown it would be unnoticeable. Note that the function behaves at ##x=1.9999999...## exactly how it does right after ##x=2##. The circle of point-discontinuity is just a symbol showing that something is going on here; it's not a real hole because point-discontinuties are actually impossible to show.
 
Last edited:
About online graphing websites [for example Desmos]:
I think that because the program is trying to show that the function is continuous on a very close interval beside the point where the function has a discontinuity, but if you click on that point it will give you its coordinate and whether it is defined or not.
Untitled23.png
 
22990atinesh said:
Why Graphing Tools doesn't represent hole in a graph of a function. A Hole at a point in a graph is point where function is not defined.Suppose there is a function

##\frac{x}{\root{x-1}-1}##

Its should be like this
Capture.jpg


But online tools and even my android graphing tool app shows graph like this
Capture_2.jpg


What I'm saying is that, apart from circle there must be some sort of marks representing that the function is not defined here.

Sorry mistyped the function ##\frac{x}{\root{x+1}-1}##
 
22990atinesh said:
Sorry mistyped the function ##\frac{x}{\root{x+1}-1}##
\root{} doesn't mean anything in LaTeX. Use \sqrt{} for a square root and \sqrt[3]{} for a cube root and similar for higher-degree roots.

Your expression should be written as # #\frac{x}{\sqrt{x+1}-1}# # (without the spaces between the # characters). This renders as ##\frac{x}{\sqrt{x+1}-1}##
 
Mark44 said:
\root{} doesn't mean anything in LaTeX. Use \sqrt{} for a square root and \sqrt[3]{} for a cube root and similar for higher-degree roots.

Your expression should be written as # #\frac{x}{\sqrt{x+1}-1}# # (without the spaces between the # characters). This renders as ##\frac{x}{\sqrt{x+1}-1}##
Hmm Sorry little mistake