Electric Field of two charges

  • #1
laser
75
10
Homework Statement
conceptual
Relevant Equations
E=F/q
Screenshot_1.png


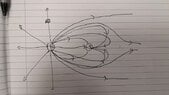
I have attached an image of what *I think* the electric field looks like. Would this be correct? I am convinced about everything here, apart from the ones on the far right. All the other ones loop from the +ve charge to the -ve charge, but where do the grey lines on the right loop to (the ones that point to the right)? One thing I can think of is that they come from infinity and don't loop from anywhere!
 
  • Like
Likes Delta2
Physics news on Phys.org
  • #2
Here you can play with your setup and use a sensor to 'measure' ##\vec E##.

A good thing to do would be to study equipotential lines and relief maps for a confguration like yours

##\ ##
 
  • Like
Likes laser, PhDeezNutz and MatinSAR
  • #3
Imagine the charges were so close together that they could not be distinguished spatially. What would the field look like? That’s how the field at infinity needs to behave.
 
  • Like
  • Love
Likes Delta2, MatinSAR and PhDeezNutz
  • #4
Also consider that the positive charge +4Q starts 4 lines for every 1 line that the negative charge -Q stops. The grey that come into the picture from above and below and curve to the right cannot be there because they have to originate at the positive charge. You have to remove them. However, the grey lines that come in from above and below and curve to the left are OK so leave them alone.
 
  • Like
Likes laser
  • #5
Remember that far away you can think of the as a point charge of +3Q(sketch it) and a dipole Q/-Q (sketch the dipole field) . The far field will be the sum and just look like a +3Q point charge when very very far away. Voila! the poor man's multipole expansion tells you what you need to know I think.
 
  • #6
hutchphd said:
Remember that far away you can think of the as a point charge of +3Q(sketch it) and a dipole Q/-Q (sketch the dipole field) .
Far away the dipole field is negligible compared to the monopole field (it falls off as 1/r^3 compared to the 1/r^2 of the monopole). Only the monopole is relevant for the far field behaviour of the field lines.
 
  • Like
Likes Delta2
  • #7
This was the poor man's multipole.. Only very very far field (my nomenclature) is pure monopole. Of course these refinements are correct, but perhaps too much information for the OP sketch.
 
  • #8
Orodruin said:
Imagine the charges were so close together that they could not be distinguished spatially. What would the field look like? That’s how the field at infinity needs to behave.
Ok, but apart from the proportion of lines that reach the -Q being too high (as @kuruman notes), the diagram in post #1 is essentially correct, no?
 
  • #9
kuruman said:
Also consider that the positive charge +4Q starts 4 lines for every 1 line that the negative charge -Q stops. The grey that come into the picture from above and below and curve to the right cannot be there because they have to originate at the positive charge. You have to remove them. However, the grey lines that come in from above and below and curve to the left are OK so leave them alone.
After going on this website https://phet.colorado.edu/sims/html/charges-and-fields/latest/charges-and-fields_all.html and playing around with the sensor, I think the electric field looks like this?

I think the "radial lines" aren't actually radial but just look radial. The question is: do they eventually loop back to the negative charge?

Alternatively, they could just go to infinity on the right hand side.
 

Attachments

  • IMG-20240123-WA0001.jpg
    IMG-20240123-WA0001.jpg
    43.9 KB · Views: 14
  • Like
Likes hutchphd
  • #10
laser said:
After going on this website https://phet.colorado.edu/sims/html/charges-and-fields/latest/charges-and-fields_all.html and playing around with the sensor, I think the electric field looks like this?

I think the "radial lines" aren't actually radial but just look radial. The question is: do they eventually loop back to the negative charge?

Alternatively, they could just go to infinity on the right hand side.
Field lines never cross
 
  • Like
Likes laser
  • #11
Orodruin said:
Field lines never cross
Good point - ignore some parts of my diagram then :D. That ruled out one possibility. However, there are two left - do the electric field lines on the left hand side go to infinity on the LHS, or do they flip at some point and go to infinity on the RHS?
 
  • #12
laser said:
Good point - ignore some parts of my diagram then :D. That ruled out one possibility. However, there are two left - do the electric field lines on the left hand side go to infinity on the LHS, or do they flip at some point and go to infinity on the RHS?
As I wrote in post #8, your original diagram was essentially correct. You just need to arrange that only about a quarter of the lines from the left pole reach the right pole.
 
  • #13
haruspex said:
Ok, but apart from the proportion of lines that reach the -Q being too high (as @kuruman notes), the diagram in post #1 is essentially correct, no?
No. Any field lines reaching infinity need to have a different straight line asymptote. If not the lines converge, indicating a field increasing at infinity. This is not clear to me fron the original diagram.
 
  • #14
haruspex said:
As I wrote in post #8, your original diagram was essentially correct. You just need to arrange that only about a quarter of the lines from the left pole reach the right pole.
I don't think it was correct after playing around with the electric field thing.
 
  • #15
laser said:
I don't think it was correct after playing around with the electric field thing.
I tried that link and it seemed to me it confirmed the essential features of your diagram. The curves are rather different, but that's less important.
Where do you think your diagram looks wrong?
 
  • #16
Orodruin said:
No. Any field lines reaching infinity need to have a different straight line asymptote. If not the lines converge, indicating a field increasing at infinity. This is not clear to me fron the original diagram.
True, the two grey lines on the right look like they are converging when they should eventually be diverging. But arguably that's just because the picture doesn’t go far enough in that direction, no?
 
  • #17
haruspex said:
True, the two grey lines on the right look like they are converging when they should eventually be diverging. But arguably that's just because the picture doesn’t go far enough in that direction, no?
Perhaps, but that feature is arguably so important that if it the picture is not drawn so far out that it is obvious, then it should be extended.
 
  • Like
Likes hutchphd and haruspex
  • #18
kuruman said:
Also consider that the positive charge +4Q starts 4 lines for every 1 line that the negative charge -Q stops.
This is true for the full 3-dimensional picture. It will not generally hold in a 2D-slice of the field lines. This is one of the reasons I always found field line density in images a bit misleading.
 
  • Like
Likes hutchphd, Mister T, PhDeezNutz and 2 others
  • #19
Orodruin said:
This is true for the full 3-dimensional picture. It will not generally hold in a 2D-slice of the field lines. This is one of the reasons I always found field line density in images a bit misleading.
Sure, that is a problem when drawing 3d lines on a 2d surface. The convention is that one takes a thin slice, in this case one that contains the line joining the two charges, and draws only the field lines that are in the plane of the slice ignoring all others. Doing this reduces the radial dependence of the field from ##1/r^2## to ##1/r##. The strength of the field is proportional to the angle it subtends, not the solid angle. This violates Gass's law but it retains the qualitative concepts that "the field is stronger where field lines are stronger" and that "twice the charge means twice as many lines per angle".

Shown below is a 3d plot of a dipolar field that I generated with grapher.app on my mac laptop. It might be a more correct representation of the filed on a 2d surface but there is too much clutter for my taste.

Dipolar Field.jpg
 
  • Like
Likes Delta2 and PhDeezNutz
  • #20
haruspex said:
I tried that link and it seemed to me it confirmed the essential features of your diagram. The curves are rather different, but that's less important.
Where do you think your diagram looks wrong?
The rightmost grey lines. Also - I think my curves were kinda off.
 
  • #21
laser said:
The rightmost grey lines. Also - I think my curves were kinda off.
It's tough to get the curves accurate without a lot of calculation. But you can correct the asymptotic appearance of the lines by ensuring they look more like the field from a single charge.
 
  • Like
Likes laser
  • #22
kuruman said:
Also consider that the positive charge +4Q starts 4 lines for every 1 line that the negative charge -Q stops. The grey that come into the picture from above and below and curve to the right cannot be there because they have to originate at the positive charge. You have to remove them. However, the grey lines that come in from above and below and curve to the left are OK so leave them alone.

Orodruin said:
This is true for the full 3-dimensional picture. It will not generally hold in a 2D-slice of the field lines. This is one of the reasons I always found field line density in images a bit misleading.

kuruman said:
Sure, that is a problem when drawing 3d lines on a 2d surface. The convention is that one takes a thin slice, in this case one that contains the line joining the two charges, and draws only the field lines that are in the plane of the slice ignoring all others. Doing this reduces the radial dependence of the field from ##1/r^2## to ##1/r##. The strength of the field is proportional to the angle it subtends, not the solid angle. This violates Gass's law but it retains the qualitative concepts that "the field is stronger where field lines are stronger" and that "twice the charge means twice as many lines per angle".

Shown below is a 3d plot of a dipolar field that I generated with grapher.app on my mac laptop. It might be a more correct representation of the filed on a 2d surface but there is too much clutter for my taste.

I had trouble creating a field line density plot for the case where the left charge has four times the magnitude (but opposite sign) because as soon as I made the charges to the values of the charges in my script the whole thing went haywire. I would agree that field line density should be more around the bigger charge.

In the meantime here is one I created for a physical dipole where both charges are equal in magnitude but opposite in sign.

I created the field in 3D and used the "streamslice" feature in matlab for the plane ##z=0##. Surprisingly "streamslice" does better at creating field line plots than "streamline". For the case of two equal but opposite charges "streamline" was giving me all sorts of problems but "streamslice" by default gave me a good picture without me having to tinker with the settings/options.

I may have to do some tinkering with "streamslice" for the case of one being +4Q and the other being -Q.
664A1183-CBB4-41A0-B9D1-D7B48DA3C021.jpeg
 
  • Like
Likes Delta2
  • #24
kuruman said:
I found the figure below here
http://www.phys.nthu.edu.tw/~hf5/EM/lecture note/EM02.pdf

The black circles are my addition. Note that twice as many field lines exit the circle surrounding the +2q as enter the circle surrounding the -q charge.

View attachment 339105
That’s not really accurate though. Close to the charges the field lines should be distributed as for a point charge (the point charge field dominates as it grows to infinite strength). In this picture they are not.

The figure is also mossing the effect talked about earlier in the right part. All in all, not very accurate.

Edit: Another obvious error is that, since the overall charge is q, a flux corresponding to q should exit to infinity. This also means that a flux corresponding to q should go from the 2q charge to the -q charge, which in turn means that for the field lines exiting the 2q charge the boundary between those field lines that reach infinity and those that end up in the -q charge should be vertical in the picture. They clearly are not.
 
Last edited:
  • #25
laser said:
I think the "radial lines" aren't actually radial but just look radial.
A tangent to the field lines is radial at the location of the point charges. Likewise for the way field lines intersect equipotential surfaces.

laser said:
The question is: do they eventually loop back to the negative charge?
They do for an infinitely large drawing. For a finite-sized drawing there will be field lines leaving and entering the edges of the drawing.
 
  • #26
PhDeezNutz said:
I had trouble creating a field line density plot for the case where the left charge has four times the magnitude (but opposite sign) because as soon as I made the charges to the values of the charges in my script the whole thing went haywire. I would agree that field line density should be more around the bigger charge.

In the meantime here is one I created for a physical dipole where both charges are equal in magnitude but opposite in sign.

I created the field in 3D and used the "streamslice" feature in matlab for the plane ##z=0##. Surprisingly "streamslice" does better at creating field line plots than "streamline". For the case of two equal but opposite charges "streamline" was giving me all sorts of problems but "streamslice" by default gave me a good picture without me having to tinker with the settings/options.

I may have to do some tinkering with "streamslice" for the case of one being +4Q and the other being -Q.
View attachment 339091
Edit: As explained, your @laser's initial diagram is largely correct. The improvements that could be made are:
  • ensure that lines heading off to infinity appear to diverge; specifically, the two grey lines going off to the right, having converged initially as shown, should then diverge
  • those two lines do not seem to have an origin; it should show where they emerge from the larger charge
  • the picture should extend far enough to show the path of those two lines from where they leave the 4Q charge to where they converge then diverge on the right
  • add more lines emerging from the left and heading off in different directions, so that the viewer can see how, on zooming out, it starts to look like a monopole field
As regards the details, it depends what you think the 2D picture represents. I see three options, all projections onto the xz plane of a 3D region (I define the y axis as normal to the page):
  1. The consensus seems to be a thin slice of constant thickness parallel to the xz plane; this is incompatible with all lines either reaching the other charge or going to infinity: there would be lines emanating from each charge which just disappear, particularly near the x axis
  2. A 2D projection of the whole 3D reality; that solves the orphaned lines problem but would lead to crossing lines
  3. as (1), but thin segments (like orange segments) instead of a constant thickness; the thickness would be proportional to distance from the x axis;
    • it solves the orphan problem
    • compared with option 1, the density of lines at a given distance from the x axis is increased in proportion to that distance
In all cases, the number of lines attached to each charge is proportional to the charge magnitude. E.g. in option 1, if we take a slice thickness dy and draw each charge as radius r then the lines at each charge show the flux through the same area in the 3D reality, ##2\pi rdy##, and four times the charge means (near the charge) four times the flux density.
 
Last edited:
  • Like
Likes laser, Delta2 and hutchphd
  • #27
Mister T said:
Likewise for the way field lines intersect equipotential surfaces.
I assume you mean normal to the equipotentials.
laser said:
The question is: do they eventually loop back to the negative charge?
Mister T said:
They do for an infinitely large drawing.
That would be true of a system with net zero charge, but here only a quarter of the lines from the 4Q charge reach the -Q charge; the rest go off to infinity, as for a monopole.
 
Last edited:
  • Like
Likes Mister T and hutchphd
  • #28
haruspex said:
As explained, your initial diagram is largely correct.
@PhDeezNutz is not the OP.
 
  • Like
Likes Delta2 and PhDeezNutz
  • #29
Orodruin said:
@PhDeezNutz is not the OP.
Thanks - edited suitably.
 
  • Like
Likes PhDeezNutz

1. How do you calculate the electric field between two charges?

To calculate the electric field between two charges, you can use the formula: E = k * |q1 - q2| / r^2, where E is the electric field, k is Coulomb's constant (8.99 x 10^9 Nm^2/C^2), q1 and q2 are the magnitudes of the charges, and r is the distance between the charges.

2. What is the direction of the electric field between two charges?

The direction of the electric field between two charges is always along the line connecting the charges. If the charges are of the same sign, the electric field points away from the charges. If the charges are of opposite signs, the electric field points towards the charges.

3. How does the distance between two charges affect the electric field?

The electric field between two charges is inversely proportional to the square of the distance between them. This means that as the distance between the charges increases, the electric field strength decreases.

4. Can the electric field between two charges be zero?

Yes, the electric field between two charges can be zero. This occurs when the charges are equal in magnitude and opposite in sign, resulting in a net electric field of zero between them.

5. What is the unit of electric field between two charges?

The unit of electric field between two charges is Newtons per Coulomb (N/C). This unit represents the force experienced by a unit positive charge placed in the electric field between the two charges.

Similar threads

  • Introductory Physics Homework Help
Replies
9
Views
261
  • Introductory Physics Homework Help
Replies
1
Views
157
  • Introductory Physics Homework Help
Replies
2
Views
901
  • Introductory Physics Homework Help
Replies
12
Views
1K
  • Introductory Physics Homework Help
Replies
17
Views
406
  • Introductory Physics Homework Help
Replies
32
Views
2K
  • Introductory Physics Homework Help
Replies
2
Views
1K
  • Introductory Physics Homework Help
Replies
7
Views
1K
  • Introductory Physics Homework Help
Replies
6
Views
923
  • Introductory Physics Homework Help
Replies
2
Views
1K
Back
Top