- #1
mathmari
Gold Member
MHB
- 5,049
- 7
Hey! 
I am looking at the following:
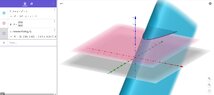
1. We have the function $f(x,y)=y-x^2-1$. Write the appropriate commands in Geogebra that draw a contour line with $f(x,y)=\frac{3709}{2000}$.
Could you give me a hint what command we have to use here? Do we just plot $y-x^2-1=\frac{1374}{2000}$ ? (Wondering)
2. Give the graph of the below functions in Geogebra and find the countour lines $f(x,y)=c$ where $c$ is in the interval $[0,10]$ and each contour line has to have distance from the next one $0.4$.
Do we use for that the command "Sequence(\cos (xy)=c, c, 0, 10)" ? (Wondering)
I am looking at the following:
1. We have the function $f(x,y)=y-x^2-1$. Write the appropriate commands in Geogebra that draw a contour line with $f(x,y)=\frac{3709}{2000}$.
Could you give me a hint what command we have to use here? Do we just plot $y-x^2-1=\frac{1374}{2000}$ ? (Wondering)
2. Give the graph of the below functions in Geogebra and find the countour lines $f(x,y)=c$ where $c$ is in the interval $[0,10]$ and each contour line has to have distance from the next one $0.4$.
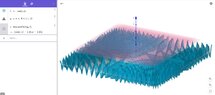
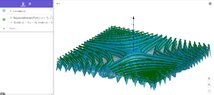
- $f(x,y)=\cos (xy)$
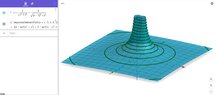
- $f(x,y)=\frac{2}{\sqrt{x^2+y^2}}+\frac{2}{\sqrt{(x-1)^2+y^2}}$
Do we use for that the command "Sequence(\cos (xy)=c, c, 0, 10)" ? (Wondering)