Frequency Response of High-Pass Filter at 1kHz

In summary, the conversation discusses using a frequency range from 10 Hz to 10 kHz to show that a circuit operates as a high-pass filter with a 'knee' point at 1 kHz. The transfer function and frequency response are mentioned as ways to demonstrate this, and the use of a simulator like LTSpice is suggested. There is also a suggestion to make the frequency axis logarithmic for better accuracy. The circuit is described as having an infinite Q quadratic zero and an almost unfactorable cubic pole, making it difficult to analyze by hand.
  • #1
leejohnson222
76
6
Homework Statement
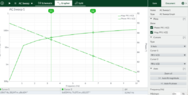
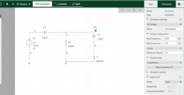
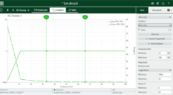
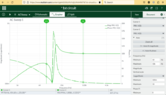
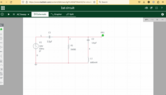
from the circuit plot the frequency response
Relevant Equations
fr Formula
use a frequency range from 10 Hz to 10 kHz and show that the circuit operates as a high-pass filter with a ‘knee’ point at 1 kHz
I have to be honest i an not 100% on what the question is asking me,
should i be working out Frequency resonance first using all the information provided, then i need to input this into a graph ?

Screenshot 2023-05-24 at 12.59.20.png
 
Physics news on Phys.org
  • #2
Since the excitation frequency is fixed, you can write the phasor equation for the transfer function and use that to show that the transfer function is HPF. You can also use that to calculate the "knee" breakpoint frequency; I don't think you need to plot anything unless you want to.

Although depending on where the output is defined on this circuit, it is a more complicated transfer function than just a simple HPF, IMO. Maybe it would be useful to plot the frequency response with some free SPICE program like LTSPICE to help you visualize the transfer function.
 
  • #3
leejohnson222 said:
I have to be honest i an not 100% on what the question is asking me
Neither am I.
What frequency response? What are the inputs and outputs?

It's hard to help people that don't give you any information to work with about their confusion. Can you show us an attempted solution? Or ask a more specific question? I don't know what you know and what you don't.
 
  • #4
"Plot the frequency response" - as exact as possible or as a classical Bode-plot which uses asymptotic lines only?
In the first case, you need the complete transfer function H(s) - while in the 2nd case, you can use some rough considerations for finding the corresponding slopes and the breakpoints (poles and zeroes).

In any case, the transfer function can be found relatively easily. In principle, it is nothing else than a complex voltage divider where the "load impedance) is R1||(Z_C2 + Z_L1)
 
  • #5
i would like to have a go at using the simulator but the links i have been sent are all for Pc and im a mac
 
  • #6
leejohnson222 said:
i would like to have a go at using the simulator but the links i have been sent are all for Pc and im a mac

Maybe try a Google search like the one below:

1686160858842.png
 
Last edited:
  • Like
Likes Lord Jestocost
  • #7
leejohnson222 said:
i would like to have a go at using the simulator but the links i have been sent are all for Pc and im a mac
LTSpice. It must work on a Mac, since everyone uses it.
 
  • Like
Likes PhDeezNutz
  • #8
Simulators are great at giving answers*, but they don't show mechanisms, reasons, very well. Go for it, knowing how to use them and what they do, and don't do, well is important. But if you want to be an analog EE, then you need to know how to figure this out without simulators. That is how you understand the effect of the individual pieces.

Most of the teaching of electronics is analysis based, they give you a circuit and ask what it does. This is contrary to much of what we do in the real world, which is the opposite; given a set of requirements design a circuit that does it. Simulators are awful at teaching that.

*Unfortunately they are quite literal. They answer the questions you actually asked, not what you meant to ask. In my real world simulator work, not the simple stuff, about 90% of the effort is in verifying that the models used are correct and testing with know conditions to verify the output is reasonable before I ever trust the answers. This requires knowing what to expect by old fashioned pencil and paper work.
 
  • Like
Likes DeBangis21
  • #9
ok so i found this one, not sure i have done it correctly, looks like a high pass filter to me in the simulation
 

Attachments

  • Screenshot 2023-06-14 at 14.57.19.png
    Screenshot 2023-06-14 at 14.57.19.png
    18.6 KB · Views: 61
  • Screenshot 2023-06-14 at 14.59.37.png
    Screenshot 2023-06-14 at 14.59.37.png
    13.8 KB · Views: 54
  • #10
leejohnson222 said:
ok so i found this one, not sure i have done it correctly, looks like a high pass filter to me in the simulation
In post #1 you said you are supposed to "use a frequency range from 10 Hz to 10 kHz".

You have shown a sweep from 0 Hz to 10 Hz. Redo the sweep for the required range and what do you get?

It would be good to make the horizontal axis logarithmic.
 
  • Like
Likes DaveE
  • #11
ok here is what i looks like now
 

Attachments

  • Screenshot 2023-06-14 at 17.59.16.png
    Screenshot 2023-06-14 at 17.59.16.png
    17.6 KB · Views: 64
  • #12
leejohnson222 said:
ok here is what i looks like now
You really need to make the frequency axis logarithmic. Also, you don't have enough resolution on the frequency axis. What is the step size during the frequency sweep?
 
  • Like
Likes DaveE
  • #13
Slightly off-topic for the OP, but...
What an odd network* to use in a beginning circuit analysis class. An infinite Q quadratic zero and an almost unfactorable cubic pole at essentially the same frequency. Very hard to do by hand. I guess if you don't care about some wiggles in the plot you can cancel the imaginary stuff. At high and low frequencies the real stuff is dominant.

*I'm assuming it's the transfer function from the source to the R1 voltage.

1686791313923.png


1686791360468.png
 
  • Like
Likes SumDood_ and berkeman
  • #14
DaveE said:
Slightly off-topic for the OP, but...
What an odd network* to use in a beginning circuit analysis class. An infinite Q quadratic zero and an almost unfactorable cubic pole at essentially the same frequency. Very hard to do by hand. I guess if you don't care about some wiggles in the plot you can cancel the imaginary stuff. At high and low frequencies the real stuff is dominant.

*I'm assuming it's the transfer function from the source to the R1 voltage.

View attachment 327890

View attachment 327891
You correctly show conjugate poles at a little over 1000 radians, but the problem asks the TS to show that there is a "knee" at 1000 Hz, which would not be produced by a pole at 1091.6 radians. I wonder if the problem poser meant to say radians rather than Hz?
 
  • Like
Likes DaveE
  • #15
The Electrician said:
You correctly show conjugate poles at a little over 1000 radians, but the problem asks the TS to show that there is a "knee" at 1000 Hz, which would not be produced by a pole at 1091.6 radians. I wonder if the problem poser meant to say radians rather than Hz?
"knee" is an odd concept with all of the polynomial crap going on around there.
Seen from far away,
as ##\omega \rightarrow \infty##, ##H(s) \rightarrow 1##
as ##\omega \rightarrow 0##, ##H(s) \rightarrow sC1R1##
which would put the knee (-3dB) at 86Hz = 541 rad/sec.
But C2 also gets involved around there, which you may look at as L1 ##\approx## 0 (below resonance),
so ##H(s) \approx \frac{C1}{(C1+C2)} \frac{1}{1+\frac{1}{(C1+C2)R1s}} ## in that region with a knee at 56Hz. But, this is wrt the cap. divider midband gain of 0.65 or -3.8dB (i.e. -6.8dB @ 56Hz).

It's kind of a mess, and except for the practice of using a computer to make a bode plot, is not appropriate for most undergraduate classes IMO.
 
  • Like
Likes SumDood_ and The Electrician
  • #16
You actually can do a pretty good approximate factorization of that cubic, for the values given, which yields this.
1686811687036.png
 
  • #17
leejohnson222 said:
ok so i found this one, not sure i have done it correctly, looks like a high pass filter to me in the simulation
The Electrician said:
You really need to make the frequency axis logarithmic. Also, you don't have enough resolution on the frequency axis. What is the step size during the frequency sweep?
@leejohnson222
Were you able to make a log-log plot of the frequency response?
It should look like something like this:

1686860537494.png


PS: Sorry for the diversion, you can just ignore all of the math if you like.
 
  • #18
DaveE said:
@leejohnson222
Were you able to make a log-log plot of the frequency response?
It should look like something like this:

View attachment 327916

PS: Sorry for the diversion, you can just ignore all of the math if you like.
Have a look at the response if the output is taken from the top of the inductor rather than from the top of the resistor. For either response I don't see anything I would call a "knee" anywhere near 1 kHz.

The TS was last seen at 1:24 yesterday afternoon; is he gone away?
 
  • #19
i was away for a few days, sorry, so i need to move the response ?
does this look more like it ? problem is i need to show freq range between 10hz and 10khz
Its probably a setting i need to chance, but i have not used this program before
 

Attachments

  • Screenshot 2023-06-20 at 19.18.40.png
    Screenshot 2023-06-20 at 19.18.40.png
    22.2 KB · Views: 59
  • Screenshot 2023-06-20 at 19.29.58.png
    Screenshot 2023-06-20 at 19.29.58.png
    13.3 KB · Views: 59
Last edited:
  • Like
Likes DaveE
  • #20
leejohnson222 said:
i was away for a few days, sorry, so i need to move the response ?
does this look more like it ? problem is i need to show freq range between 10hz and 10khz
Its probably a setting i need to chance, but i have not used this program before
When I click on the first screenshot, it shows a plot from 10Hz to 10 kHz, so you're ok. Your problem says that you are supposed to show that there is a "knee" around 1 kHz, but your plot doesn't show that. You should ask your instructor if you have been given the correct circuit.
 
  • #21
I just wanted to share this because I think some posters and future readers might find this of interest even though I think the question has already been answered very well.

I personally think for a graphing problem, that this circuit is intuitive even for an introductory circuit course. That's because introductory courses cover voltage dividers, and that series capacitance (C) and shunt resistance (R) behaves like a high-pass filter (HPF). In the introductory course I took they covered resonance circuits such as series inductance (L) and capacitance, and also all parallel L and C. Series L and C behaves like a thru short circuit at resonance.

So when I look at this circuit I'm seeing here looks like a HPF, then I see there series L and C that would behave like a short to ground at resonance. The plots I saw above behave very close to my expectation, which can be done by eyeball inspection using this way of thinking.

Something that was not covered in my introductory course... I learned it at my first full-time position and someone recommended a book that covered it really well (Fundamentals of Power Electronics by Erickson)... it's call the Middlebrook Extra Element Theorem. I think this is a very good use case for that one. Again: I look at it and say I know how some of the circuit behaves without some elements. I can remove that L and C that is in series to ground and say "I know how this HPF behaves, but what does this extra element(s) do?" Check it out. I recommend trying it out with a well-known resistive voltage divider to see if you can apply it, and then repeat the procedures on this circuit here. https://en.wikipedia.org/wiki/Extra_element_theorem

Below I just did it with the resistive voltage divider because we know 2R parallel to 2R behaves like R, and we know how a voltage divider behaves when the resistors are the same. It's obviously not required for this problem, but I do think it's interesting and I come across a lot of cases where I understand really well how a circuit behaves if it didn't have some darn extra element :) now the problem is no more, and it's just fun to explore a bunch of different circuits or trying to break some of them. I use it for work, and even in classes where I'll stumble upon in an exam the professor is trying to be tricky and turned a known good circuit into something that's a little off.

Something to be cautious of is that I did not always understand at the beginning was the nulling. You should follow the procedures of placing a test source there and getting the voltage and current that nulls Vout (drives it to zero). In this particular case: It can be done by inspection because Znull happens to be a short anyways, but directly shorting to ground or making Vout zero is not the right approach, and it just so happens that you can "get away with it" (or get lucky) in this simple case but if you tried it where the extra element was parallel to the series R, then you might not be so lucky.

gGl486z.jpg
 
Last edited:
  • Like
Likes SumDood_ and DaveE
  • #22
Joshy said:
I learned it at my first full-time position and someone recommended a book that covered it really well (Fundamentals of Power Electronics by Erickson)... it's call the Middlebrook Extra Element Theorem.
That's an excellent book. He was one of Middlebrook's grad students while I was there, and he has done a faithful job of recreating that material. It was taught to juniors/seniors at Caltech by Middlebrook, but for most undergrad EE programs, I think the EET is too advanced. YMMV.

The material about constructing bode plots by hand from transfer functions (i.e. really understanding them) is really important and should be required for all undergrad analog EEs IMO. It's not difficult, but seems not to be taught most places.
 
  • Like
Likes berkeman
  • #23
The Electrician said:
When I click on the first screenshot, it shows a plot from 10Hz to 10 kHz, so you're ok. Your problem says that you are supposed to show that there is a "knee" around 1 kHz, but your plot doesn't show that. You should ask your instructor if you have been given the correct circuit.
ok i will do that, it asks me to consider the combined series, parallel RLC circuit, plot it with a simulator and use the vertical axis for Voltage current source and freq on the horizontal, show the circuit operates a hpf with a knee at 1khz. I will see if there is something the tutor can assist with
 
  • #24
leejohnson222 said:
.....use the vertical axis for Voltage current source ..........
What`s that?
 
  • Haha
Likes berkeman
  • #25
i assume they just mean Voltage range, i just type it as its written
 
  • #26
If you gave me a box with those parts in it and asked for a HPF. I would build the circuit below. You just aren't going to get a 1KHz knee with those component values, they are too big. The closest you'll get is to cheat and put the two caps in series to make a 1uF equivalent which will give a quadratic pole at 179 Hz, which is about 1K rad/sec. Or you can leave the inductor out and get single pole at 244 Hz.

1687368950075.png
 
Last edited:
  • #27
I appear to be on the same course as the OP, and I have tried multicap and multisim and both gave me the same answer which neither have a "Knee" point at at 1kHz. Interestingly, the course work does little to prepare you for this question, as its the final question in the assessment paper, and the final section of the course work is related to transformers and not RLC circuits.

Going to have a proper read over some of the things discussed this far and see if it sheds any light on this.

Thanks guys and good luck to the OP, hope he found the answer to this!
 
  • #28
GSwales88 said:
I appear to be on the same course as the OP, and I have tried multicap and multisim and both gave me the same answer which neither have a "Knee" point at at 1kHz. Interestingly, the course work does little to prepare you for this question, as its the final question in the assessment paper, and the final section of the course work is related to transformers and not RLC circuits.

Going to have a proper read over some of the things discussed this far and see if it sheds any light on this.

Thanks guys and good luck to the OP, hope he found the answer to this!
After you pass this course, tell your instructor to read this thread. If I was his dean, we'd have a talk...
 

1. What is the frequency response of a high-pass filter at 1kHz?

The frequency response of a high-pass filter at 1kHz refers to how the filter affects the amplitude of a signal at that specific frequency. In other words, it shows how much of the input signal at 1kHz is allowed to pass through the filter and how much is attenuated.

2. How does a high-pass filter affect signals below 1kHz?

A high-pass filter allows signals above a certain frequency (in this case, 1kHz) to pass through, while attenuating or blocking signals below that frequency. This means that signals below 1kHz will be reduced in amplitude or completely removed by the filter.

3. What is the cutoff frequency of a high-pass filter at 1kHz?

The cutoff frequency of a high-pass filter at 1kHz is the frequency at which the filter begins to attenuate or block signals. In this case, the cutoff frequency is 1kHz, meaning that signals below 1kHz will be affected by the filter.

4. How does the slope of a high-pass filter at 1kHz affect the frequency response?

The slope of a high-pass filter at 1kHz refers to how quickly the filter attenuates or blocks signals below the cutoff frequency. A steeper slope means that the filter will have a more drastic effect on the frequency response, while a shallower slope will have a more gradual effect.

5. What are the applications of a high-pass filter at 1kHz?

A high-pass filter at 1kHz is commonly used in audio equipment to remove low-frequency noise or unwanted signals. It can also be used in communication systems to remove unwanted signals or to isolate specific frequency ranges. Additionally, high-pass filters are often used in electronic circuits to prevent damage to sensitive components from low-frequency signals.

Similar threads

  • Engineering and Comp Sci Homework Help
Replies
15
Views
977
  • Engineering and Comp Sci Homework Help
Replies
16
Views
2K
  • Engineering and Comp Sci Homework Help
Replies
10
Views
1K
  • Engineering and Comp Sci Homework Help
Replies
4
Views
1K
  • Engineering and Comp Sci Homework Help
Replies
7
Views
897
  • Engineering and Comp Sci Homework Help
Replies
1
Views
805
  • Engineering and Comp Sci Homework Help
Replies
16
Views
963
  • Engineering and Comp Sci Homework Help
Replies
8
Views
2K
  • Engineering and Comp Sci Homework Help
Replies
5
Views
962
  • Engineering and Comp Sci Homework Help
Replies
3
Views
1K
Back
Top