- #1
mathmari
Gold Member
MHB
- 5,049
- 7
Hey! 
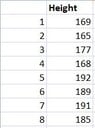
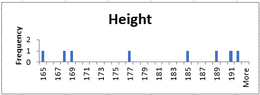
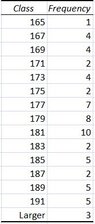
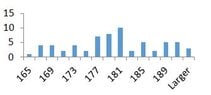
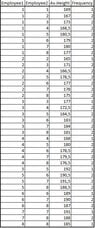
In the following table there are the heights of the employees of a company:
View attachment 9455
In the following table there are the heights of the employees of a company:
View attachment 9455
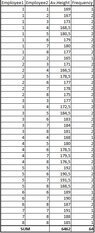
- Calculate the mean value, the variance and the standard deviation of the heights of the employees.
- Determine the distribution of sampling with replacement of average number of children of each employee for sample size $2$.
- Which is the mean value and the variance of the sampling average?
- Which is the mean value of the sampling variances?
- Which is the mean value of the sampling standard deviations?
- The mean value is equal to $\frac{1436}{8}=179.5$.
The variance is equal to $\displaystyle{s^2=\frac{\sum_{i=1}^n\left (x_i-\overline{x}\right )^2}{n}}$.
The standard deviation is equal to $\displaystyle{s=\sqrt{108.5}=10.42}$.
- I don't really understand this question. How is this related to the given data? Is there maybe a typo and instead of number of children it should be the height? But even in this case, I don't understand what we have to do here. Do you have an idea? (Wondering)